. 2014 Jan 7;111(1):E109-18.
doi: 10.1073/pnas.1312585111. Epub 2013 Dec 23.

Trapping of naive lymphocytes triggers rapid growth and remodeling of the fibroblast network in reactive murine lymph nodes

Affiliations

Trapping of naive lymphocytes triggers rapid growth and remodeling of the fibroblast network in reactive murine lymph nodes

Chen-Ying Yang et al. Proc Natl Acad Sci U S A. .

Abstract

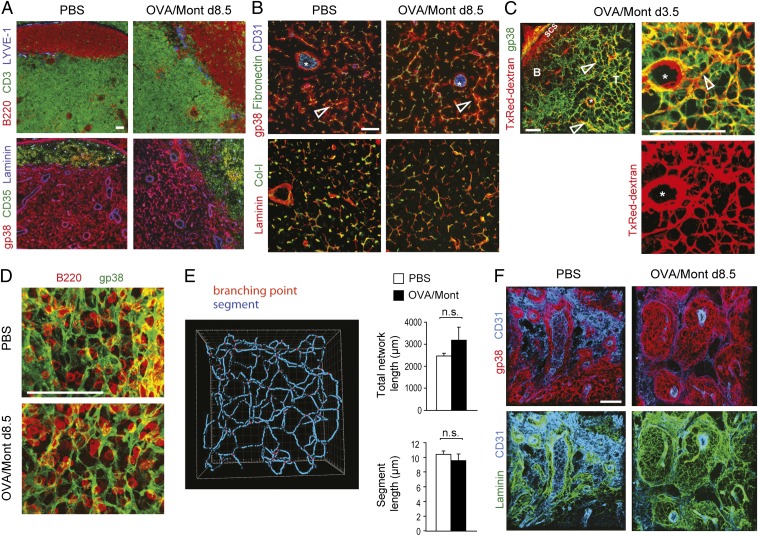
Adaptive immunity is initiated in T-cell zones of secondary lymphoid organs. These zones are organized in a rigid 3D network of fibroblastic reticular cells (FRCs) that are a rich cytokine source. In response to lymph-borne antigens, draining lymph nodes (LNs) expand several folds in size, but the fate and role of the FRC network during immune response is not fully understood. Here we show that T-cell responses are accompanied by the rapid activation and growth of FRCs, leading to an expanded but similarly organized network of T-zone FRCs that maintains its vital function for lymphocyte trafficking and survival. In addition, new FRC-rich environments were observed in the expanded medullary cords. FRCs are activated within hours after the onset of inflammation in the periphery. Surprisingly, FRC expansion depends mainly on trapping of naïve lymphocytes that is induced by both migratory and resident dendritic cells. Inflammatory signals are not required as homeostatic T-cell proliferation was sufficient to trigger FRC expansion. Activated lymphocytes are also dispensable for this process, but can enhance the later growth phase. Thus, this study documents the surprising plasticity as well as the complex regulation of FRC networks allowing the rapid LN hyperplasia that is critical for mounting efficient adaptive immunity.

Keywords: MyD88; fibroblasts; lymph node swelling; lymphotoxin; stromal cells.


Conflict of interest statement

The authors declare no conflict of interest.

Figures

Fig. 1.
Fig. 1.
FRCs and endothelial cells expand rapidly during immune response in draining peripheral LNs. (A–D) Splenocytes from OT-1 (OVA-specific CD8+ TCR tg) and OT-2 (OVA-specific CD4+ TCR tg) C57BL/6 mice on a CD45.1+ background were transferred into C57BL/6 (CD45.2+) recipient mice, which then received s.c. injections of OVA/Mont or PBS, along with BrdU administration. The six draining peripheral LNs were isolated at the indicated time points after immunization, digested, and then analyzed by flow cytometry. (A) Number (Upper) and proliferation (BrdU incorporation; Lower) of indicated cell populations from PBS-control (open circles) and OVA/Mont-immunized (closed circles) mice. (B) Representative dot plots of DAPICD35CD45 pregated stromal cells identifying FRCs (gp38+CD31), LECs (gp38+CD31+), and BECs (gp38CD31+). Percentages indicated show the cell frequency among all living cells. (C) Representative histograms showing FRCs stained with an antibody to BrdU (white) or an isotype-matched control (gray area) at 8.5 d after PBS or OVA/Mont injection. (D) Number (Upper) and proliferation (Lower) of FRCs, LECs, and BECs at indicated time points after OVA/Mont immunization. (E) WT C57BL/6 mice were infected with L. major in both footpads. On day 19, the two draining popliteal LNs were isolated, enzymatically digested, and analyzed as described above. Data are mean ± SD, representative of two or three independent experiments with n ≥3 mice per group.
Fig. 2.
Fig. 2.
FRCs increase in size within 20 h and proliferate within 40 h after immunization. (A) Number and proliferation of FRCs, LECs, and BECs in the six draining LNs at 40 h after OVA/Mont immunization, as described in Fig. 1. (B and C) Representative histograms and kinetics for FSC (size; B) and SSC (granularity; C) flow cytometry profiles of FRCs at indicated time points after OVA/Mont immunization. The OVA/PBS ratio shows the FSC and SSC levels of FRCs from OVA/Mont-injected mice relative to PBS-injected mice. (D) Cell number and proliferation analysis of FRCs, LECs, and BECs at day 58 after OVA/Mont immunization. BrdU was administered to mice for only the last 5.5 d before sacrifice. Data are mean ± SD, representative of two or three independent experiments, with n ≥3 mice per group.
Fig. 3.
Fig. 3.
FRCs from swollen LNs exhibit an activated phenotype. (A) (Upper) Representative histograms and mean fluorescence intensity (MFI) for the surface expression of gp38 and PDGFRα on FRCs in the LNs of PBS-injected (black line) or OVA/Mont-injected (red line) mice at 5.5 d after immunization. Surface protein expression on CD45+ cells served as a negative control (gray area). (Lower) Kinetics of surface gp38 expression on FRCs at indicated time points after OVA/Mont immunization (closed circles) relative to PBS control (open circles). (B) Representative images showing expression of the myofibroblast marker α-SMA in LN sections obtained at the indicated time points after OVA/Mont immunization, as assessed by immunofluorescence labeling. Asterisks indicate HEVs surrounded by smooth muscle cells, and open arrows indicate reticular FRCs that costained for PDGFRβ. Labeling, exposure time, and image processing were identical for all time points shown. (C) mRNA expression of Il7, Ccl19, and Ccl21 were measured in stroma-enriched (white bars) and lymphocyte-enriched (gray bars) fractions from draining LNs at 0, 3.5, and 8.5 d after immunization and then normalized to two housekeeping genes, as described in Materials and Methods. (D) Representative images of in situ hybridization analysis showing Ccl19 and Ccl21 transcripts (green) in LN sections on days 0, 5.5, and 8.5 after OVA/Mont immunization, along with B220 antibody staining (red). All slides were treated similarly (ISH development, exposure time for photos, and processing of images). Data in A, B, and D are mean ± SD, representative of two or three independent experiments, with n ≥3 mice per group. n.s., statistically not significant. (Scale bars: 100 μm.)
Fig. 4.
Fig. 4.
An expanding FRC network preserves its usual structure and function while extending into medullary cords. Immunofluorescence microscopy of cryostat sections (A and B) or 80-μm-thick vibratome sections (C–F) from draining LNs of PBS- or OVA/Mont-immunized mice were labeled with the indicated antibodies. (A) B220+ B cells and CD3+ T cells indicate B and T zones, respectively. LYVE-1 stains lymphatic vessels. Consecutive sections show FRC (gp38+CD35) and FDC (gp38+/−CD35+) networks, as well as the laminin-positive basement membranes of vessels and conduits. (B) Higher-magnification image of the T zone showing CD31+ HEVs (asterisks) and reticular FRCs (gp38+) wrapped around fibronectin-positive conduits (open arrows). Conduits are composed of collagen I-positive (Col-I) fibrils surrounded by a laminin-positive basement membrane. (C) Texas (Tx) Red-dextran was injected s.c. at 3.5 d after OVA/Mont immunization, draining LNs isolated 30 min thereafter, followed by their processing for histological labeling. Open arrows highlight TxRed-dextran–positive conduits surrounded by gp38+ FRCs; the asterisk denotes an HEV with a perivascular space rich in TxRed-dextran. (D) Vibratome sections of the LN T zone in PBS- and OVA/Mont-immunized mice demonstrating a similar density and architecture as for the gp38+ FRC network. B220+ B cells are shown for a size comparison. (E) Filament tracer software was used to quantify the total network length and segment length of individual FRCs in images derived from gp38-labeled vibratome sections (mean ± SD), as shown in D. (F) Vibratome sections showing medullary cords displaying extensive gp38+ reticular FRC networks wrapping around laminin-positive structures and connecting with CD31high HEVs. The cords are demarcated by a thin layer of CD31intgp38+ lymphatic endothelium. Data are representative of two to three experiments with at least two mice and six LNs per mouse. (Scale bars: 100 μm.)
Fig. 5.
Fig. 5.
DC- and MyD88-dependent signals regulate FRC growth during the immune response. The total cellularity, number of FRCs, and proliferation of FRCs were measured in six draining LNs by flow cytomety at day 3 (B and D) or day 5.5 (A, C, and E) after immunization. (A) Mice that received OT T cells (closed circles) or did not receive OT T cells (open circles) were immunized with PBS, Mont, or OVA/Mont. Statistics were calculated on a pool of all data points. (B) CD11c-DTR tg or ntg littermate mice received OT T cells, were injected with a single dose of DT to deplete DCs, and finally were immunized with PBS or OVA/Mont. (C) WT mice were immunized s.c. with WT or MyD88 KO BMDCs activated with either LPS or CpG without loading of OVA antigen. (D) CD11c-DTR tg or ntg littermate mice were treated with a single dose of DT and then immunized s.c. with PBS or WT BMDCs activated with CpG without OVA antigen. (E) WT or MyD88 KO mice were immunized with WT BMDCs activated with CpG without loading of OVA antigen. Data are mean ± SD from at least two experiments, with n ≥3 mice per experiment.
Fig. 6.
Fig. 6.
Naive lymphocytes and LTβR signaling are required to trigger FRC expansion. Total LN cellularity, as well as the number and proliferation of FRCs, were measured by flow cytometry in six draining LNs at 5.5–6 d (A, B, DF) or 3 d (C) after the indicated immunization. (A) WT or T/B-cell-deficient (RAG2 KO) mice were immunized s.c. with PBS or WT BMDCs activated with CpG without OVA antigen. (B) WT mice received i.p. injections of PBS or IL-7/α-IL-7 complexes each day for the first 4 d. (C and D) Mice that received OT T cells were injected with LTβR-Fc or control (ctrl) IgG and then immunized with OVA/Mont or PBS, followed by the flow cytometry analysis of six draining LNs at day 3 (C) or day 5.5 (D) after immunization. (E) Representative histogram (Left) and mean fluorescence intensity (MFI; Right) for the surface expression of LTβR on FRCs in LNs of PBS-injected (black line) or OVA/Mont-injected (dashed line) mice. Surface protein expression on CD45+ cells served as a negative control (gray area). (F) OT T cells were adoptively transferred into CD11c-DTR tg or ntg littermate mice, which were then immunized s.c. with OVA/Mont and received a single dose of DT at 3 d after immunization. Data are pooled from two independent experiments that are represented by circles and triangles. Data are mean ± SD, either representative of (A, C, and E) or compiled from (B, D, and F) at least two experiments, with n ≥3 mice per experiment.

References

    1. Mueller SN, Germain RN. Stromal cell contributions to the homeostasis and functionality of the immune system. Nat Rev Immunol. 2009;9(9):618–629. - PMC - PubMed
    1. Turley SJ, Fletcher AL, Elpek KG. The stromal and haematopoietic antigen-presenting cells that reside in secondary lymphoid organs. Nat Rev Immunol. 2010;10(12):813–825. - PubMed
    1. Link A, et al. Fibroblastic reticular cells in lymph nodes regulate the homeostasis of naive T cells. Nat Immunol. 2007;8(11):1255–1265. - PubMed
    1. Angeli V, et al. B cell-driven lymphangiogenesis in inflamed lymph nodes enhances dendritic cell mobilization. Immunity. 2006;24(2):203–215. - PubMed
    1. Mohr E, et al. Dendritic cells and monocyte/macrophages that create the IL-6/APRIL-rich lymph node microenvironments where plasmablasts mature. J Immunol. 2009;182(4):2113–2123. - PubMed

Publication types

MeSH terms

Substances