. 2014 Jan 7;111(1):E178-87.
doi: 10.1073/pnas.1318750111. Epub 2013 Dec 23.

Cortical neural populations can guide behavior by integrating inputs linearly, independent of synchrony

Affiliations

Cortical neural populations can guide behavior by integrating inputs linearly, independent of synchrony

Mark H Histed et al. Proc Natl Acad Sci U S A. .

Abstract

Neurons are sensitive to the relative timing of inputs, both because several inputs must coincide to reach spike threshold and because active dendritic mechanisms can amplify synchronous inputs. To determine if input synchrony can influence behavior, we trained mice to report activation of excitatory neurons in visual cortex using channelrhodopsin-2. We used light pulses that varied in duration from a few milliseconds to 100 ms and measured neuronal responses and animals' detection ability. We found detection performance was well predicted by the total amount of light delivered. Short pulses provided no behavioral advantage, even when they concentrated evoked spikes into an interval a few milliseconds long. Arranging pulses into trains of varying frequency from beta to gamma also produced no behavioral advantage. Light intensities required to drive behavior were low (at low intensities, channelrhodopsin-2 conductance varies linearly with intensity), and the accompanying changes in firing rate were small (over 100 ms, average change: 1.1 spikes per s). Firing rate changes varied linearly with pulse intensity and duration, and behavior was predicted by total spike count independent of temporal arrangement. Thus, animals' detection performance reflected the linear integration of total input over 100 ms. This behavioral linearity despite neurons' nonlinearities can be explained by a population code using noisy neurons. Ongoing background activity creates probabilistic spiking, allowing weak inputs to change spike probability linearly, with little amplification of coincident input. Summing across a population then yields a total spike count that weights inputs equally, regardless of their arrival time.

Keywords: mouse; neuronal circuits; optogenetics; population coding.


Conflict of interest statement

The authors declare no conflict of interest.

Figures

Fig. 1.
Fig. 1.
Animals directly detect activation of cortical neurons by ChR2. (A) Schematic showing how spike synchrony among inputs affects input conductance. (Top) Simulated asynchronous (Left) or synchronous (Right) input spikes. (Bottom) Schematic of a conductance waveform that would result from summation of the same conductance response from each spike (convolution of spikes with an exponentially decaying response). (B) Change-detection behavior. Animals press a lever to initiate the trial, and after a random delay we deliver a light pulse to stimulate ChR2-expressing neurons. Animals respond by releasing the lever. Responses before the stimulus are false alarms; failures to release quickly (within 450 ms) are classified as misses. Correct releases are rewarded; errors cause the trial to end, and a delay is imposed before the next trial. (C) Histological section showing ChR2-expressing neurons, pseudocolored with yellow indicating highest fluorescence. The injection is a few hundred microns in diameter (see Fig. S1 for the distribution of responsive neurons). The area between neurons is densely labeled red because ChR2 is expressed in cell membranes throughout the neuropil. (Scale bar: 100 µm.) (Inset) Detailed view showing a cell with membrane expression (2) and one with less expression (1). (Scale bar, 20 µm.) (D and E) Typical behavioral sessions showing that animals are good psychophysical observers. (Upper) Psychometric functions. Horizontal black line: 95% CI for threshold. (Lower) Reaction times. Heavy lines are hyperbolic function fits; yellow points indicate means; error bars show SEM. At the highest stimulus intensity, reaction times are much shorter for direct cortical stimulation than for visual stimuli, because animals detect signals that bypass the sensory periphery. (F) Performance relies on optical excitation of ChR2 neurons, showing that animals detect changes in cortical activity and not retinal stimulation with blue light. The y axis shows the behavioral threshold (calculated as shown in D and E; 95% CIs). The left value shows the behavioral threshold when the excitation light spot is directed at ChR2 neurons; on the right, the elevated threshold reflects worse performance when the light spot is displaced ∼500 µm away from ChR2 expression peak (n = 1 animal, 15 behavioral sessions; see Fig. S2 for more details.).
Fig. 2.
Fig. 2.
Behavioral detection thresholds show that inputs can be integrated linearly. (A) An example of psychometric functions from two sessions in one animal. Dark blue, 100-ms pulse; cyan, 10-ms pulse; green, 1-ms pulse. Data shown in solid cyan and dark blue (single points shown with rightward-oriented triangles) were collected in one session; dotted cyan and green curves (leftward-oriented triangles) were obtained in a second session; within a session, trials were randomly intermixed. The x axis shows the peak power of each square pulse. Horizontal lines indicate the 95% CIs around each pulse duration's threshold. (B) An example of behavioral detection as a function of total pulse power. Data are from a second animal (n = 10 sessions.) The x axis shows total pulse power in millijoules per square millimeter, or peak power in milliwatts per square millimeter (as in A) times pulse duration in seconds. Other conventions are as in A. (C) The threshold is nearly linearly proportional to pulse time. Data are from the animal in B. Black points indicate threshold measurements for pulses of different durations (95% CI), slightly offset on the x axis for clarity. Blue lines connect pairs of measurements made in a single session (no normalization). The heavy red line indicates the linear fit; slope −1.01. (D) Summary of data from four animals. Each color represents one animal (blue, animal with data in A; red, animal in B). Error bars at 1, 10, and 100 ms indicate the SEM. For each animal, data include at least five points at 1 and 100 ms and at least 10 points at 10 ms. Data are normalized to the threshold at either 10 ms or 100 ms, one of which was measured each day. Slope range: −0.85 to −1.01. The slope measures animals’ ability to integrate inputs; the offset on the y axis reflects only changes in absolute power threshold and could arise from many sources, including variation in dural thickness or slight differences in expression level (Fig. S2). Animals’ lapse rates were low (median <3%), and neither lapse rate nor slope varied with pulse duration (Fig. S7).
Fig. 3.
Fig. 3.
ChR2 stimulation changes neuronal firing during behavior. (A) An example of psychometric behavioral performance, with three power levels highlighted: blue, below threshold; green, near threshold; and red, above threshold. Error bars: 95% binomial CIs. The x axis shows the total power for a 100-ms linear ramp; other conventions are as in Fig. 1 D and E. (B) Single-neuron response showing few spikes were fired per trial. (Upper) Raster; each dot is a spike. (Lower) Spike histograms showing probability of spiking over time. The single neuron fired 0.2 spikes per trial at a power slightly above threshold (green). (C) Population sum over 33 units (eight single and 25 multiunits) from one behavioral session. Colored bands are SD over trials of sum. The activity in the population just above threshold (green) corresponds to an average of 0.23 extra spikes per recorded unit. (D) ChR2-evoked neuronal responses are similar during and outside the behavioral task. The x axis shows responses during behavior. The y axis shows responses while the animal was nonbehaving but awake and given occasional rewards (about one per minute) to maintain alertness. Each point is a single or multiunit at one power; powers are colored as in A; diamonds indicate data shown in B. (E and F) ChR2-evoked responses from a small neuronal population at powers above behavioral threshold. Data are mean responses over all units (n = 19; 5 single and 14 multiunits) from one recording session, collected from an awake animal (light yellow in Fig. 2D) outside behavior (see text and Fig. 4). (E) Spike responses increase as power is increased (pulse duration fixed at 100 ms). (F) Responses increase as pulse duration is increased (power fixed at 0.6 mW/mm2).
Fig. 4.
Fig. 4.
Population spike count varies linearly with light power and duration. (A) Population response at four powers while varying duration. Blue points show the mean number of spikes above baseline per neuron per trial, over a 120-ms period after the start of stimulation. Error bars indicate SEM. The heavy black line shows the best linear fit; thin black lines show the 95% CI for the slope. The similar slopes indicate that response scaling with duration is similar across a range of total powers. (B) Population response at four durations while varying peak power; again, slopes are similar, implying similar response scaling with peak power. Conventions are as in A. Data are from two animals (thresholds in yellow, red in Fig. 2D); 243 units, 53 single and 190 multiunits. (C and D) 3D views of the data shown in A and B. Black or red lines show contours at fixed values of total power (or peak power*duration); the red line shows the value at 0.01 mJ/mm2, just above the behavioral threshold. Lines show the plane defined by the regression described in the text; numbers near each line indicate the regression coefficient β times the total power for that line and give the number of spikes per cell per trial at that total power. (C) A rotation of the 3D axis in which the entire surface and spacing of total power contours are visible. (D) A different rotation of the same data showing a view along the plane of constant total power. The number of spikes fired above baseline is well predicted by this plane. A and B use linear scales for the axes, on which the extra spikes fall along straight lines. C and D show the same data on a log scale for all three axes so that the total power contours are straight lines. Because the relationship between total power and spike response is approximately linear (i.e., exponential with an exponent of 1), on the log z axis the number of spikes falls along a nearly flat plane. The plane reflects that total power is the best predictor of population response (see text, P < 10−120 via regression). (E) Time course of linear population responses for pulses of constant total power, for low powers near the behavioral detection threshold. Colors represent different pulse lengths. The baseline rate is indicated by a solid black line (partially obscured). The dotted black line represents the prediction for a 100-ms pulse response using the 3-ms response, assuming the same total number of evoked spikes. (Inset) Total number of spikes evoked above baseline by each pulse length, normalized by number of spikes evoked by the 3-ms pulse. Error bars indicate the SEM of the population spike count across trials. n = 75 units, 26 single and 49 multiunits, one animal. Peak power of 100-ms pulse is 0.05 mW/mm2 (total power, 0.005 mJ). Data in AE were collected during the awake, rewarded condition (y axis, Fig. 3D) to maximize the number of trials and statistical power. (F) ChR2 total conductance is linear across power and pulse length, as long as power is low. Conductance change [computed using the model of Nikolic et al. (29)] is almost exactly linear when less than 3% of ChR2 molecules are recruited (dark line and Inset) and deviates for the shortest pulses at 10 times this power (dashed and dotted line), principally because of saturation.
Fig. 5.
Fig. 5.
Stimulation near the behavioral threshold produces small changes in the activity of many cells. Each point is the activity of one of 441 units (110 single, 331 multiunits) recorded from the same two animals shown in yellow and red in Fig. 2D. (A) Spike count in the absence of ChR2 stimulation, illustrating the size of our measurement noise (average over 90–110 repetitions). The y axis shows spike count in a 100-ms period with no stimulation, minus the count in a baseline period of the same duration. Each point is one unit, ordered (x axis) by mean absolute baseline firing rate (unit baselines: 10th percentile, 0.28 spikes/s; median, 2.8 spikes/s; 90th percentile, 9.9 spikes/s). (B) Spike counts in response to ChR2 stimulation at a power just above the behavioral threshold (0.1 mW/mm2, 100-ms square pulse, 0.01 mJ/mm2). See Fig. S1 for spatial locations of recording sites. The single filled circle is a multiunit that fired 1.95 spikes per stimulus, shifted down to the axis limit for visual clarity. The mean response is 0.11 spikes per stimulus (an average change in rate of 1.1 spike/s over 100 ms), which is nearly identical to threshold found by the slope in Fig. 4 A and D. These data were collected during the awake, rewarded condition (y axis, Fig. 3D) to maximize the number of trials and statistical power.
Fig. 6.
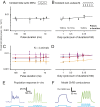
Fig. 6.
Synchronization of inputs does not affect behavior over a wide range of frequencies. (A) Single-animal example for varying pulse duration with near-constant 50% duty cycle. (Slight deviations of duty cycle from 50% result because pulse durations always are multiples of 1 ms). The total train length is held constant at 100 ms, and the pulse number (and thus pulse duration, to keep 50% duty cycle) is varied. For example, the train with pulses of 20-ms duration has three 20-ms pulses (with two 20-ms gaps between them), resulting in a repetition frequency of 25 Hz. The train with pulses 11 ms in duration has five pulses (and four gaps) for a frequency of 45 Hz (schematic shown in Inset). The y axis shows the threshold (95% CI) in units of total integrated light intensity (mJ/mm2, or mW/mm2 times the sum of pulse durations for that train). As predicted by linear integration, different pulse durations give similar total power thresholds. The black line shows the linear fit. We additionally normalize each day’s threshold measurement (black) by the ratio of that session's control 100-ms threshold (gray points, slightly offset horizontally for visual clarity) to the mean 100-ms threshold for that animal to reduce noise by slightly reducing session-to-session fluctuations in threshold (Fig. 2 C and D). (B) Data from a single animal showing the pulse duration while the number of pulses was held constant (all trains have five pulses with an 11-ms period, 45 Hz). The x axis shows the duty cycle, or total power as a fraction of the power of the 100-ms pulse. Other conventions are as in A. The slope is not significantly different from zero (P > 0.05), but any upward slope of the regression line would show that short pulses (of similar total power and thus higher amplitude) are less effective than long pulses at driving behavior, a result opposite that expected from cells’ threshold nonlinearities. (C and D) Summary over four animals. Each color represents a different animal. Red data are for the animal shown in A and B; the animals and the colors are the same as in Fig. 2. Error bars: 95% CI, except for 100-ms control pulses: SEM. There is little variation in the behavioral threshold, as shown by near-zero slopes (no slope is significantly different from zero; P > 0.05 via linear regression, corrected for multiple comparisons.) Upward trends in D suggest that short pulses may be even less effective in driving behavior at similar total power. (E) Responses in small populations (powers above behavioral threshold) verify that that pulsed stimulation evokes synchrony in cortical neurons; conventions are as in Fig. 3 E and F (average over n = 19 units, 5 single and 14 multiunits). (F) ChR2 model simulation shows that at low light levels conductance oscillations are limited by ChR2 kinetics, and there is substantial oscillation at 45 Hz, as we observed in vivo (E; also see Fig. 4E).

Similar articles

Cited by

References

    1. Bruno RM, Sakmann B. Cortex is driven by weak but synchronously active thalamocortical synapses. Science. 2006;312(5780):1622–1627. - PubMed
    1. Steriade M. Impact of network activities on neuronal properties in corticothalamic systems. J Neurophysiol. 2001;86(1):1–39. - PubMed
    1. Sjöström PJ, Rancz EA, Roth A, Häusser M. Dendritic excitability and synaptic plasticity. Physiol Rev. 2008;88(2):769–840. - PubMed
    1. Xu NL, et al. Nonlinear dendritic integration of sensory and motor input during an active sensing task. Nature. 2012;492(7428):247–251. - PubMed
    1. Palmer LM, et al. The cellular basis of GABA(B)-mediated interhemispheric inhibition. Science. 2012;335(6071):989–993. - PubMed

Publication types

Substances