Liver stiffness: a novel parameter for the diagnosis of liver disease
- PMID: 24367208
- PMCID: PMC3846375
- DOI: 10.2147/hmer.s7394
Liver stiffness: a novel parameter for the diagnosis of liver disease
Abstract
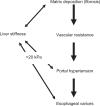
The noninvasive quantitation of liver stiffness (LS) by ultrasound based transient elastography using FibroScan® has revolutionized the diagnosis of liver diseases, namely liver cirrhosis. Alternative techniques such as acoustic radiation impulse frequency imaging or magnetic resonance elastography are currently under investigation. LS is an excellent surrogate marker of advanced fibrosis (F3) and cirrhosis (F4) outscoring all previous noninvasive approaches to detect cirrhosis. LS values below 6 kPa are considered as normal and exclude ongoing liver disease. LS of 8 and 12.5 kPa represent generally accepted cut-off values for F3 and F4 fibrosis. LS highly correlates with portal pressure, and esophageal varices are likely at values >20 kPa. Many other factors may also increase LS such as hepatic infiltration with tumor cells, mast cells (mastocytosis), inflammatory cells (all forms of hepatitis) or amyloidosis. In addition, LS is directly correlated with the venous pressure (eg, during liver congestion) and is increased during mechanic cholestasis. Thus, LS should always be interpreted in the context of clinical, imaging and laboratory findings. Finally, LS has helped to better understand the molecular mechanisms underlying liver fibrosis. The novel pressure-stiffness-fibrosis sequence hypothesis is introduced.
Keywords: fibrosis; liver disease; liver stiffness; transient elastography.
Figures


References
-
- Bravo AA, Sheth SG, Chopra S. Liver biopsy. N Engl J Med. 2001;344(7):495–500. - PubMed
-
- Abdi W, Millan JC, Mezey E. Sampling variability on percutaneous liver biopsy. Arch Intern Med. 139(6):667–669. - PubMed
-
- Bedossa P, Dargere D, Paradis V. Sampling variability of liver fibrosis in chronic hepatitis C. Hepatology. 2003;38(6):1449–1457. - PubMed
-
- Cadranel JF, Rufat P, Degos F. Practices of liver biopsy in France: results of a prospective nationwide survey. For the Group of Epidemiology of the French Association for the Study of the Liver (AFEF) Hepatology. 2000;32(3):477–481. - PubMed
-
- Maharaj B, Maharaj RJ, Leary WP, et al. Sampling variability and its influence on the diagnostic yield of percutaneous needle biopsy of the liver. Lancet. 1986;1(8480):523–525. - PubMed
Publication types
LinkOut - more resources
Full Text Sources
Other Literature Sources
Miscellaneous

