. 2013;9(12):e1003290.
doi: 10.1371/journal.pcbi.1003290. Epub 2013 Dec 19.

Perturbation biology: inferring signaling networks in cellular systems

Affiliations

Perturbation biology: inferring signaling networks in cellular systems

Evan J Molinelli et al. PLoS Comput Biol. 2013.

Abstract

We present a powerful experimental-computational technology for inferring network models that predict the response of cells to perturbations, and that may be useful in the design of combinatorial therapy against cancer. The experiments are systematic series of perturbations of cancer cell lines by targeted drugs, singly or in combination. The response to perturbation is quantified in terms of relative changes in the measured levels of proteins, phospho-proteins and cellular phenotypes such as viability. Computational network models are derived de novo, i.e., without prior knowledge of signaling pathways, and are based on simple non-linear differential equations. The prohibitively large solution space of all possible network models is explored efficiently using a probabilistic algorithm, Belief Propagation (BP), which is three orders of magnitude faster than standard Monte Carlo methods. Explicit executable models are derived for a set of perturbation experiments in SKMEL-133 melanoma cell lines, which are resistant to the therapeutically important inhibitor of RAF kinase. The resulting network models reproduce and extend known pathway biology. They empower potential discoveries of new molecular interactions and predict efficacious novel drug perturbations, such as the inhibition of PLK1, which is verified experimentally. This technology is suitable for application to larger systems in diverse areas of molecular biology.


Conflict of interest statement

The authors have declared that no competing interests exist.

Figures

Figure 1
Figure 1. Perturbation cell biology.
Perturbing cancer cells with targeted drugs singly and in pairs (A) reveals context-specific response to therapies and illuminates protein interactions. We construct dynamic mathematical models of the cells' response to drugs that have both quantitative parameters (B) and a qualitative network interpretation (C). We use an inference algorithm called Belief Propagation (BP) to construct a set of good, i.e., predictive models (D).
Figure 2
Figure 2. Iteration process for Belief Propagation.
Top panel: the global information consists of collecting the probability distributions of the non-cavity parameters without the contribution from the cavity condition. This is a simple product over all formula image factors except that from the cavity constraint μ. Distributions centered on zero denote unlikely interactions (see j = 2), centered on the right of zero denote likely positive interactions (see j = 3), and centered on the left denote likely negative interactions (see j = N). These distributions inform the parameters of the Gaussian distribution for the mean-field, aggregate sum variable formula image. The distribution formula image summarizes the state of the non-cavity parameters. Bottom panel: we calculate the probability of each possible parameter assignment formula image to the cavity parameter wik constrained to the data in the cavity condition. This calculation boils down to a simple convolution of the fitness function with a fixed parameter assignment formula image with the probability of the aggregate sum variable formula image, obtained by integrating over all values of formula image. Each assignment formula image contributes proportional to the area under the curve. The resulting update is the contribution of condition μ on the distribution of formula image, denoted formula image. This recently updated distribution becomes part of the global information for successive updates to other parameters.
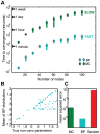
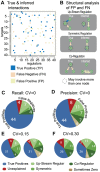
Figure 3
Figure 3. BP is significantly faster than Monte Carlo (MC) with comparable accuracy.
(A) BP converges three orders of magnitude faster than MC, even as the size of the system increases to 100 nodes. In this test, the number of training patterns equals the number of nodes in both BP and MC. (B) The means of the distributions from BP are plotted against the true non-zero parameters from the set of the data generators. BP has a high correlation (R = 0.7) with the true parameter values, with many points exactly on the diagonal. (C) MC and BP produce low errors per data point compared to random interaction assignments (Red bar).
Figure 4
Figure 4. Detailed performance on a single synthetic data-generating network.
The average parameters from the BP distributions are compared with the true interactions in the synthetic data generator. The color-coded matrix (A) summarizes all inferred and true interactions. While BP recovers many of the true interactions, some of the interactions are missing (orange; false negatives) while others are incorrect (yellow; false positives). We identified three compensatory motifs (B), which relate false positives to false negatives. Collectively, these classes of compensatory motifs contribute to most of the false negatives (C) and false positives (D). In D, we've also included a category for interactions that have a significant probability of being zero (a non interaction). Even in the presence of considerable noise, (E, F) a significant number of interactions are correctly captured and most of the falsely inferred edges participate in compensatory motifs.
Figure 5
Figure 5. Systematic perturbation experiments.
(A) Perturbation experiments with systematic combinations of eight small molecule inhibitors, applied in pairs and as single agents in low (light green) and high (dark green) doses. The perturbation agents target specific signaling molecules, detailed in the table. The listed drug dose is the standard drug dose (light green), and two times the standard dose was used for the high dose conditions (dark green). The degree of response is the approximate ratio of downstream effector levels in treated condition compared to untreated condition. (B) The response profile of melanoma cells to perturbations. The response profile includes changes in 16 protein levels (total and phosho-levels, measured with RPPA technology) and cell viability phenotype relative to those in no-drug applied condition. The slashed-zero superscript denotes the unperturbed data.
Figure 6
Figure 6. Predictive power of network models.
Eight distinct leave-7-out cross validation calculations indicate a strong fit between the predicted and experimental response profiles. In each cross-validation experiment, network models are inferred with partial data, which lacks responses to all combinations of a given drug. Next, network models are executed with in silico perturbations to predict the withheld conditions. The cumulative correlation coefficient in all conditions between predicted and experimental profiles is 0.87 (CV = 0.05). Few prediction outliers deviate from experimental values more than 1 σ (standard deviation of the experimental values, dashed lines).
Figure 7
Figure 7. The distribution of edges in all network models and average network model.
The probability distribution of edge values (wij) after BP (A, left) are similar to the histograms of the corresponding interactions after decimation (A, right). An interaction strength is nonzero when it has high amplitude and frequency in solution space. We generate instantiated models with BP guided decimation algorithm followed by gradient descent optimization. According to the agreement between the distributions in two panels, BP probability distribution and final model histogram are similar to each other with important exceptions. The BP guided decimation algorithm goes beyond simply sampling from the BP models and may encounter features such as mutual exclusivity during the creation of the final models. (B) The average network model over the 100 best solutions with lowest error capture known interactions such as those in the RAF/MEK/MAPK and PI3K/AKT pathways. The opacities of the edges scale with the absolute probability of the edges. Note that the letter ′a′ is prefixed to so-called activity nodes as explained in Methods section.
Figure 8
Figure 8. Novel predictions from in silico perturbations.
(A) The histogram of phenotypic response profiles to the four most effective virtual perturbations from the best 100 network models. The response to STAT3p705 reflects the effect of PKCi on cell viability. Viability changes in response to perturbations on cell cycle proteins PLK1 and Cyclin B1 are genuine predictions from the network models. Perturbation of TSC2pT1462 (inhibitory phosphorylation) down regulates the PI3K/AKT pathway and leads to a decrease in cell viability in the PTEN null SKMEL133 cell line. (B) The perturbed nodes that lead to reduction in cell viability in the context of average network model (Circled in red).
Figure 9
Figure 9. Experimental testing of computational predictions.
Qualitative analysis of networks from in silico simulations nominates PLK1 and Cyclin B1 as potential targets to kill RAF inhibitor resistant melanoma cells. A validation experiment with the PLK1 inhibitor BI2536 shows extensive growth inhibition in SKMEL133 cells (Cell viability IC50 = 5.8 nm). PLK1 inhibitor is a pure prediction of the approach and was not included in the experimental drug set.

Similar articles

Cited by

References

    1. Hanahan D, Weinberg RA (2011) Hallmarks of cancer: the next generation. Cell 144: 646–674. - PubMed
    1. Bollag G, Hirth P, Tsai J, Zhang J, Ibrahim PN, et al. (2010) Clinical efficacy of a RAF inhibitor needs broad target blockade in BRAF-mutant melanoma. Nature 467: 596–599. - PMC - PubMed
    1. de Bono JS, Logothetis CJ, Molina A, Fizazi K, North S, et al. (2011) Abiraterone and increased survival in metastatic prostate cancer. N Engl J Med 364: 1995–2005. - PMC - PubMed
    1. Tran C, Ouk S, Clegg NJ, Chen Y, Watson PA, et al. (2009) Development of a second-generation antiandrogen for treatment of advanced prostate cancer. Science 324: 787–790. - PMC - PubMed
    1. Druker BJ, Talpaz M, Resta DJ, Peng B, Buchdunger E, et al. (2001) Efficacy and safety of a specific inhibitor of the BCR-ABL tyrosine kinase in chronic myeloid leukemia. N Engl J Med 344: 1031–1037. - PubMed

Publication types