

Structural control of metabolic flux
- PMID: 24367246
- PMCID: PMC3868538
- DOI: 10.1371/journal.pcbi.1003368
Structural control of metabolic flux
Abstract
Organisms have to continuously adapt to changing environmental conditions or undergo developmental transitions. To meet the accompanying change in metabolic demands, the molecular mechanisms of adaptation involve concerted interactions which ultimately induce a modification of the metabolic state, which is characterized by reaction fluxes and metabolite concentrations. These state transitions are the effect of simultaneously manipulating fluxes through several reactions. While metabolic control analysis has provided a powerful framework for elucidating the principles governing this orchestrated action to understand metabolic control, its applications are restricted by the limited availability of kinetic information. Here, we introduce structural metabolic control as a framework to examine individual reactions' potential to control metabolic functions, such as biomass production, based on structural modeling. The capability to carry out a metabolic function is determined using flux balance analysis (FBA). We examine structural metabolic control on the example of the central carbon metabolism of Escherichia coli by the recently introduced framework of functional centrality (FC). This framework is based on the Shapley value from cooperative game theory and FBA, and we demonstrate its superior ability to assign "share of control" to individual reactions with respect to metabolic functions and environmental conditions. A comparative analysis of various scenarios illustrates the usefulness of FC and its relations to other structural approaches pertaining to metabolic control. We propose a Monte Carlo algorithm to estimate FCs for large networks, based on the enumeration of elementary flux modes. We further give detailed biological interpretation of FCs for production of lactate and ATP under various respiratory conditions.
Conflict of interest statement
The authors have declared that no competing interests exist.
Figures
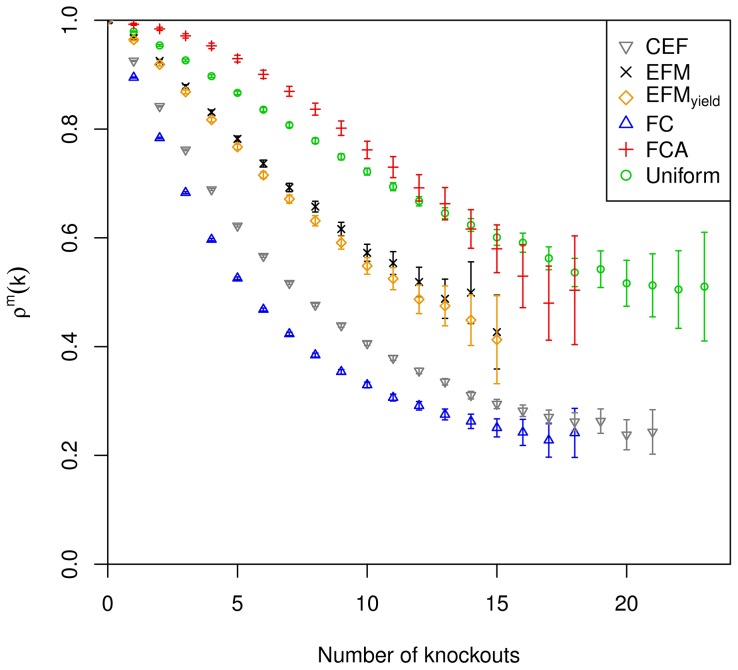
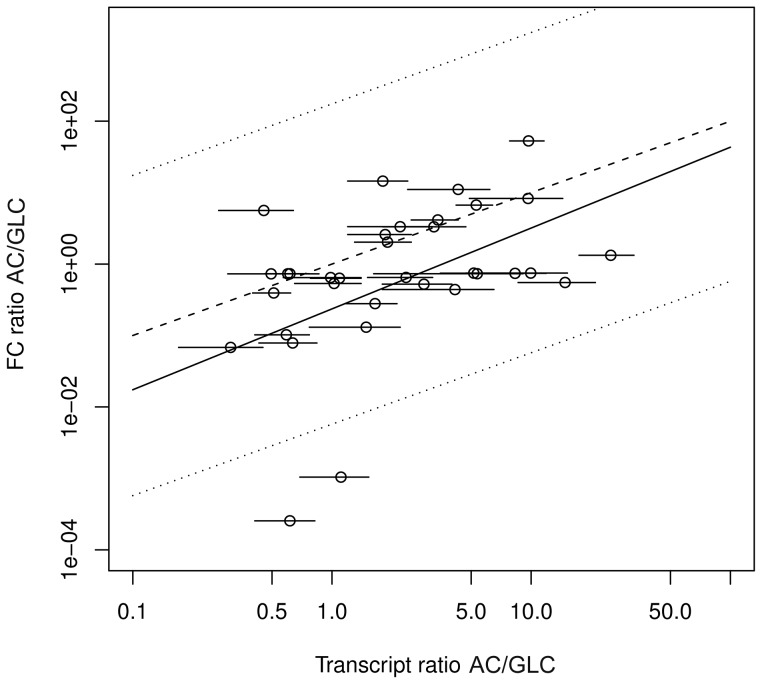
 and indicate 95% confidence intervals. Results are only depicted for a relative standard error smaller than 10%.
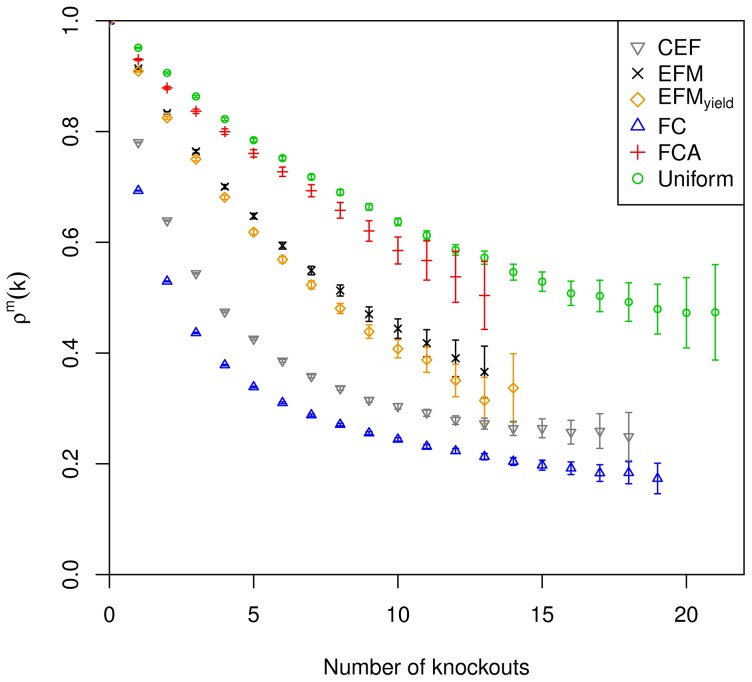
 and indicate 95% confidence intervals. Results are only depicted for a relative standard error smaller than 10%.
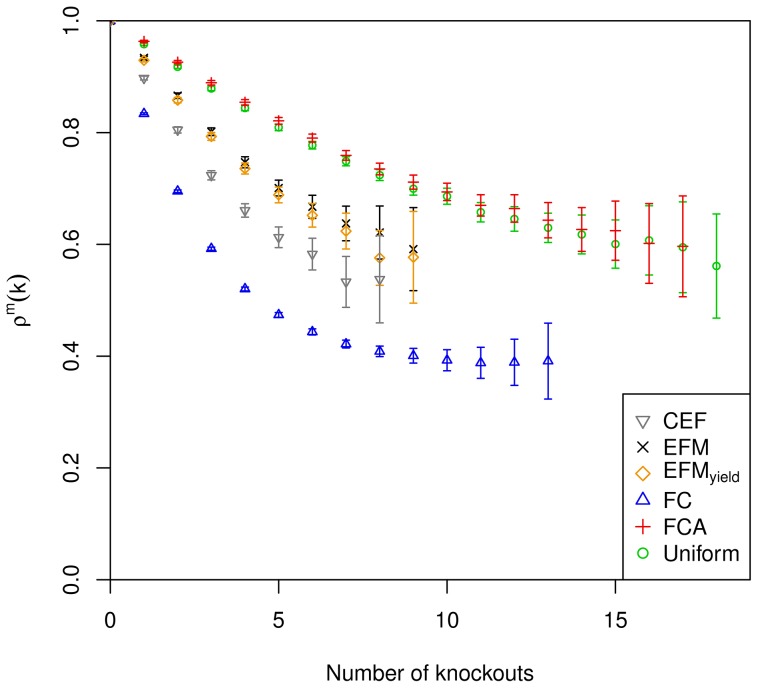
 and indicate 95% confidence intervals. Results are only depicted for a relative standard error smaller than 10%.
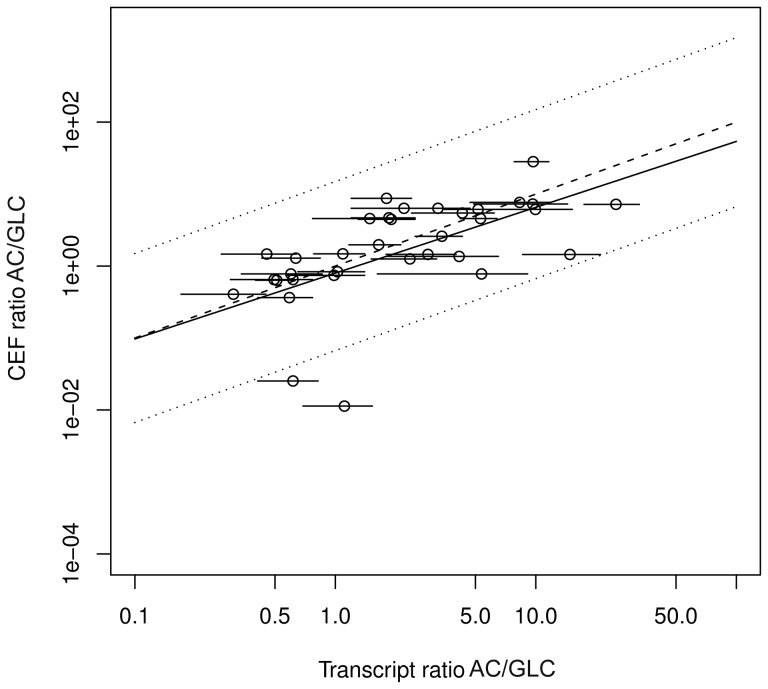
References
-
- Savageau MA (1983) Escherichia coli habitats, cell-types, and molecular mechanisms of gene-control. Am Nat 122: 732–744.
-
- Smith H (1982) Light quality, photoperception, and plant strategy. Annu Rev Plant Physiol Plant Mol Biol 33: 481–518.
-
- McCree KJ, Loomis RS (1969) Photosynthesis in fluctuating light. Ecology 50: 422–428.
Publication types
MeSH terms
LinkOut - more resources
Full Text Sources
Other Literature Sources
