

Electrodiffusive model for astrocytic and neuronal ion concentration dynamics
- PMID: 24367247
- PMCID: PMC3868551
- DOI: 10.1371/journal.pcbi.1003386
Electrodiffusive model for astrocytic and neuronal ion concentration dynamics
Abstract
The cable equation is a proper framework for modeling electrical neural signalling that takes place at a timescale at which the ionic concentrations vary little. However, in neural tissue there are also key dynamic processes that occur at longer timescales. For example, endured periods of intense neural signaling may cause the local extracellular K(+)-concentration to increase by several millimolars. The clearance of this excess K(+) depends partly on diffusion in the extracellular space, partly on local uptake by astrocytes, and partly on intracellular transport (spatial buffering) within astrocytes. These processes, that take place at the time scale of seconds, demand a mathematical description able to account for the spatiotemporal variations in ion concentrations as well as the subsequent effects of these variations on the membrane potential. Here, we present a general electrodiffusive formalism for modeling of ion concentration dynamics in a one-dimensional geometry, including both the intra- and extracellular domains. Based on the Nernst-Planck equations, this formalism ensures that the membrane potential and ion concentrations are in consistency, it ensures global particle/charge conservation and it accounts for diffusion and concentration dependent variations in resistivity. We apply the formalism to a model of astrocytes exchanging ions with the extracellular space. The simulations show that K(+)-removal from high-concentration regions is driven by a local depolarization of the astrocyte membrane, which concertedly (i) increases the local astrocytic uptake of K(+), (ii) suppresses extracellular transport of K(+), (iii) increases axial transport of K(+) within astrocytes, and (iv) facilitates astrocytic relase of K(+) in regions where the extracellular concentration is low. Together, these mechanisms seem to provide a robust regulatory scheme for shielding the extracellular space from excess K(+).
Conflict of interest statement
The authors have declared that no competing interests exist.
Figures
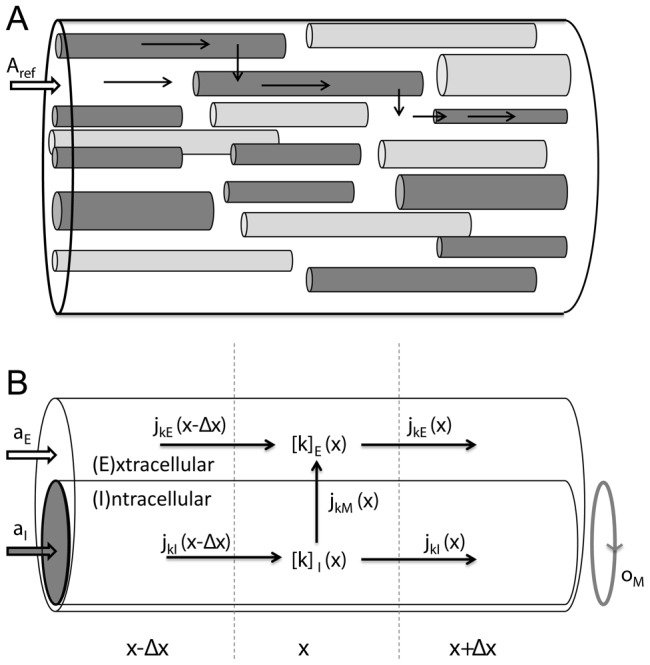
 and an arbitrary extension
  in the
  -direction. The tissue contains cells (dark grey) that participate in the transport process, and cells that do not (light grey). (B) The interior of all participatory cells represented as a single, equivalent cylindrical cable (
 ), coated by ECS (
 ). The geometry is specified by three parameters, where
  and
and  are, respectively, the fractions of
  occupied by the ICS of participatory cells and the ECS, and
  is the amount of membrane area per tissue volume (or, equivalently, the circumference of the equivalent cable divided by
  ). Due to the presence of other cells (non-participatory), we generally have that
  . The concentration of ion species
  is denoted
  where
where  represents domain
  or
or  . Ionic movement is described by the transmembrane flux density (
 ) and the longitudinal flux densities due to electrical migration (
 ) and diffusion (
 ).
).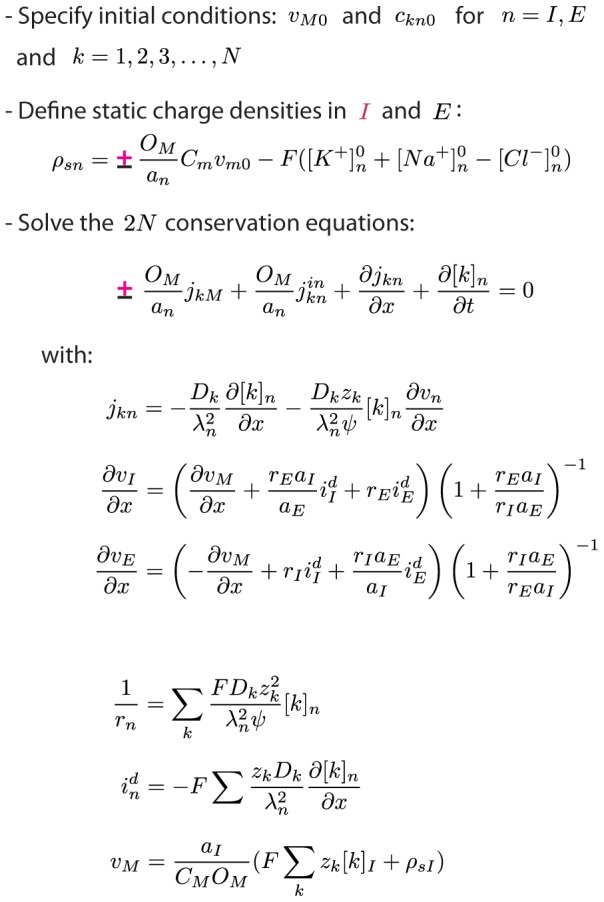
 ) and “−” should be used for the extracellular domain (
 ). The formalism is general to the choice of membrane mechanisms.
  , representing system specific membrane mechanisms (ion pumps, ion channels, cotransporters ect.), must to be specified by the user. External input to the system must also be specified. The input must be locally electroneutral, i.e., must fulfill
  .
.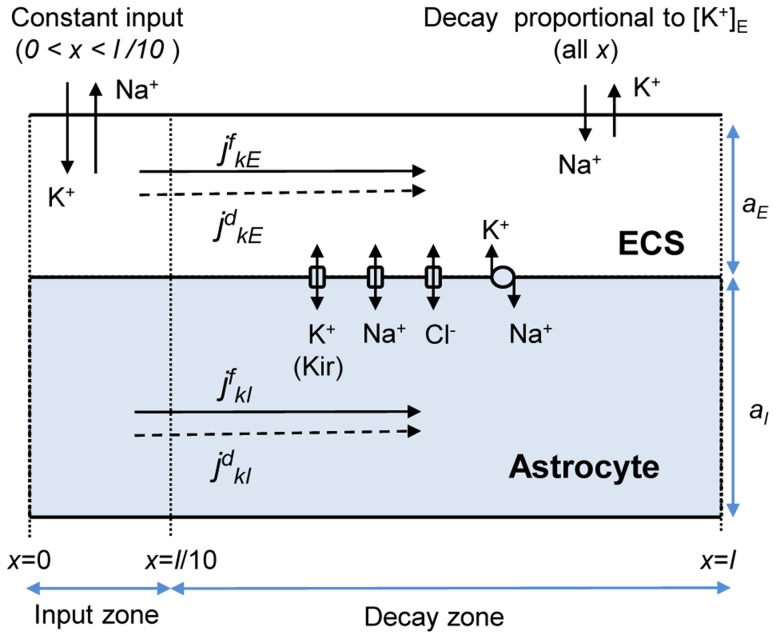
 or diffusion
  through the ICS (
 ) or ECS (
 ). The cation-exchange input was a constant influx of K+ and efflux of Na+ to/from the ECS of the input zone (defined as the region
  ). The cation-exchange output was an efflux of K+ and influx Na+ from/to the ECS. The output was proportional to the local K+-concentration, and occurred over the whole axis. The decay zone was defined as the part of the axis where no input was applied (
 ), i.e., the region where there was a net efflux of K+ from the system.
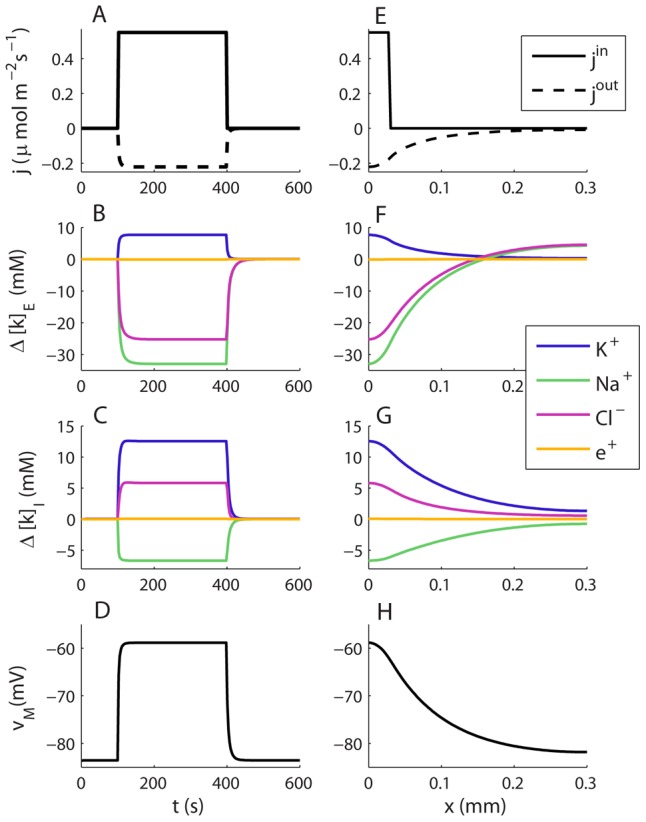
 ) in the input zone. (E–H) Spatial profiles of selected variables at a time
  , when the system was in steady state. The constant cation-exchange input was applied to the ECS of the input (
 ) zone from
  to
to  . (A) The input and output flux densities of K+ to the point
  . We recall that the Na+ input/output (not shown) was the opposite of that of K+:
  and
and  . (B,D) During the input, ion concentrations in the ECS and ICS changed, but reached steady state after about 10–50 s after stimulus onset. (B)
  (at
(at  ) had then increased by about 7.7 mM with respect to the baseline value. (C)
  had increased by about 12.5 mM due to uptake by the astrocyte. (D) The astrocytic membrane potential had been depolarized to about −59 mV at
  . The impact of the input was smaller outside the input zone. (F–H) Deviations from the baseline ionic concentrations and
  typically decreased with
  . Far away from the input zone (
 ), the conditions were close to the baseline conditions. (B–C, F–G) Ionic concentrations were represented in terms of deviations from resting concentrations:
  for
for  . For direct comparison with ion concentrations, the charge density was represented as an equivalent concentration of unit charges
  .
.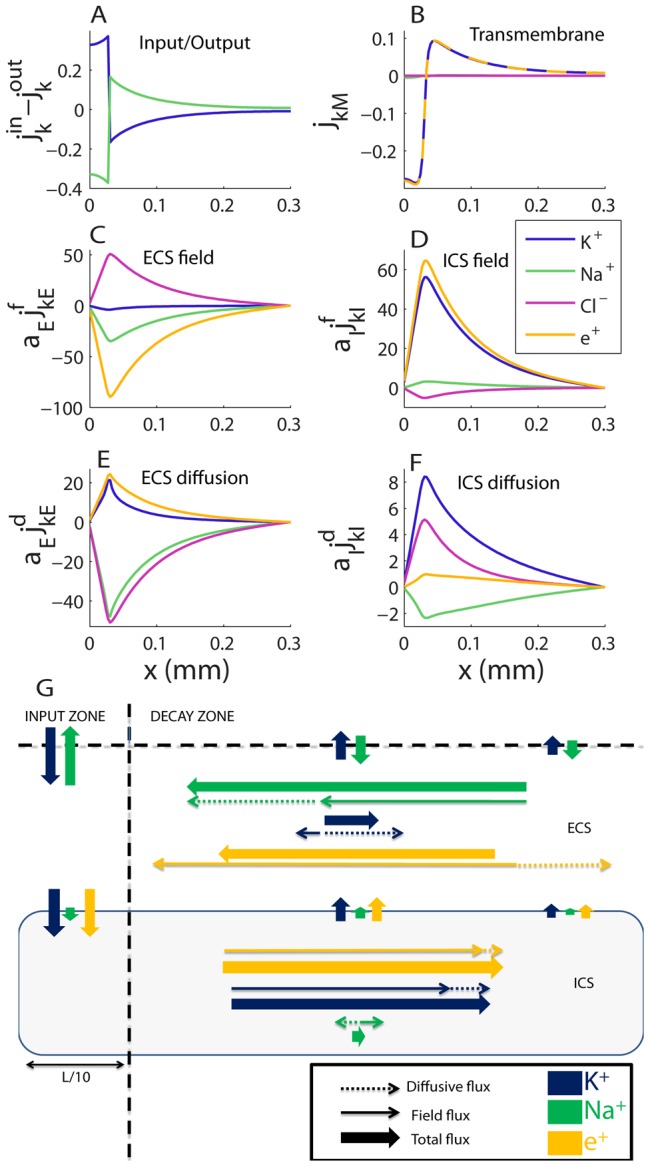
 ). (B) Transmembrane flux densities. (C–F) Longitudinal flux densities due to (C) electrical migration in the ECS, (D) electrical migration in the ICS, (E) diffusion in the ECS and (F) diffusion in the ICS. (A–D) To aid comparison, flux densities
  were scaled by the relative area fraction
  (e.g., if
  ,
,  and
and  carry the same the net flux of ion species
  ). (G) A flow chart that qualitatively summarizes the essential information in (A–F), showing the main transport routes of K+ and Na+ during SS (Cl− excluded from the overview). K+ generally entered the system in the input zone and left the system from some point along the astrocyte axis. The transport route of K+ (from entering to leaving the system) was predominantly intracellular, demonstrating the astrocyte's efficiency as a spatial buffer. Na+ entered in the decay zone and left from the input zone. Na+ transport predominantly took place in the ECS. The illustration (G) is qualitative - longer arrows mean higher flux densities, but the mapping from (A–F) to (G) is not quantitatively exact. The input zone was in the region
  . Units on the
  -axis are
  in all panels.
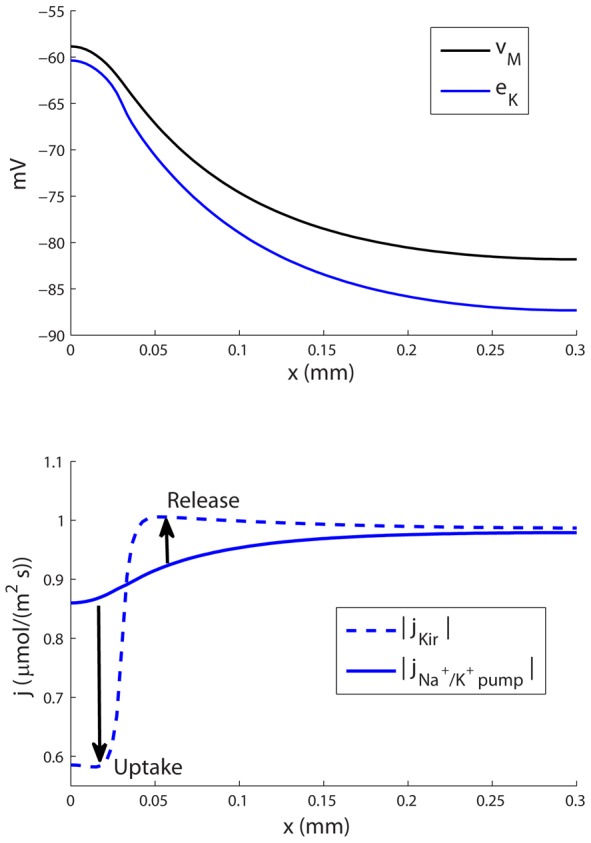
 ) was more negative than
  at all points along the
  -axis. The Kir-channel thus exclusively mediated an outward K+-current. (B) In the input zone
  was close to
  , and the outward Kir-current was small compared to the inward current through the Na+/K+-pump. In the decay zone, the outward Kir-current was bigger, and dominated over the inward current through the Na+/K+-pump. Therefore, the astrocyte took up up K+ in the input zone, and released K+ in the decay zone (as indicated by arrows in (B)).
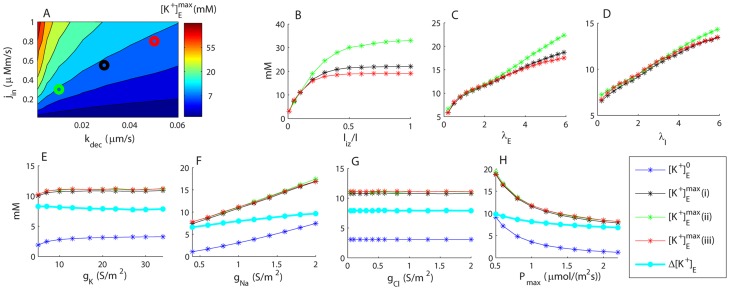
 (maximal extracellular
  in the input zone) to variation in selected model parameters. (A) Sensitivity to input flux density (
 ) and the output rate constant (
 ). Similar values of
  were obtained for the three marked data points: (i) black:
  ,
,  (default conditions), (ii) green:
  ,
,  , and (iii) red:
  ,
,  . B–D) Sensitivity to the length of the input zone (
 ), and tortuosities in the ECS (
 ) and ICS (
 ). (E–H) Sensitivity of
  and
and  (baseline extracellular
  ) to membrane conductances (
 ,
,  and
and  ), and the maximal Na+/K+-pump rate (
 ).
).  . (B–H) The legend applies to all panels. Black (i), red (ii) and green (iii) lines correspond to the input-parameter combinations marked in (A).
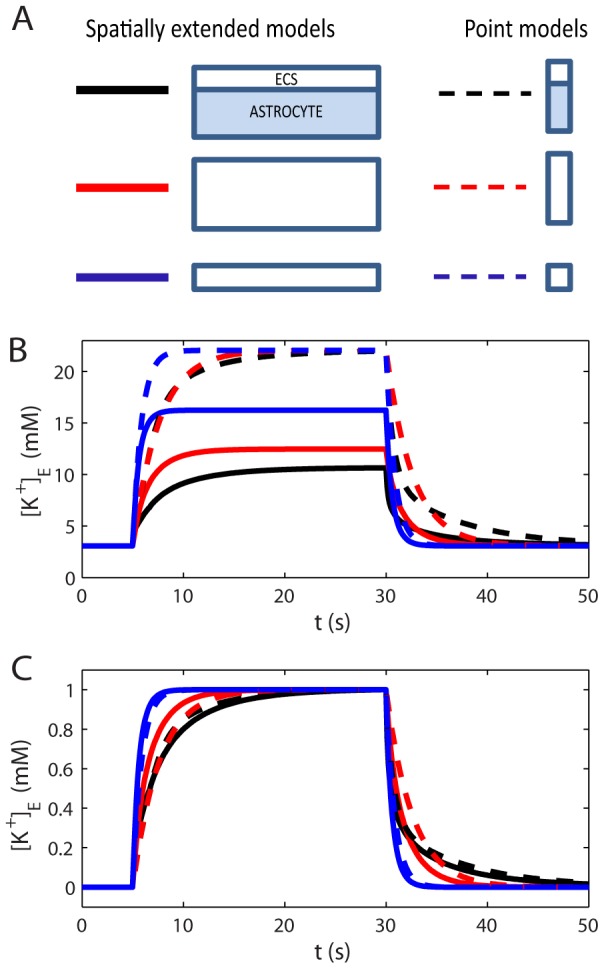
 ). In two versions (blue lines), the original ECS volume fraction (
 ) was kept when the astrocyte was removed. (B) The performance of the six model versions were compared in terms of maximal
  in the input zone during a constant K+ influx to the system. (C) To compare the time course of the
  dynamics, the responses (in B) were normalized to the peak amplitude for each respective trace.
References
-
- Hansson E, Rönnbäck L (2003) Glial neuronal signaling in the central nervous system. FASEB journal: official publication of the Federation of American Societies for Experimental Biology 17: 341–8. - PubMed
-
- Zagami C, O'shea R, Lau C (2005) Regulation of glutamate transporters in astrocytes: evidence for a relationship between transporter expression and astrocytic phenotype. Neurotoxicity 7: 143–149. - PubMed
-
- Simard M, Nedergaard M (2004) The neurobiology of glia in the context of water and ion homeostasis. Neuroscience 129: 877–96. - PubMed
Publication types
MeSH terms
Substances
LinkOut - more resources
Full Text Sources
Other Literature Sources
Medical
Molecular Biology Databases
