. 2013;9(12):e1003779.
doi: 10.1371/journal.ppat.1003779. Epub 2013 Dec 19.

Transcriptional analysis of murine macrophages infected with different Toxoplasma strains identifies novel regulation of host signaling pathways

Affiliations

Transcriptional analysis of murine macrophages infected with different Toxoplasma strains identifies novel regulation of host signaling pathways

Mariane B Melo et al. PLoS Pathog. 2013.

Abstract

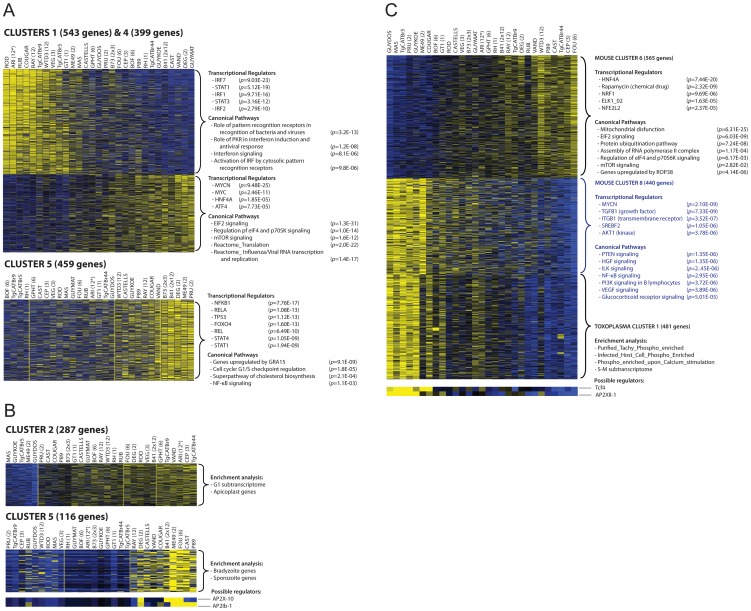
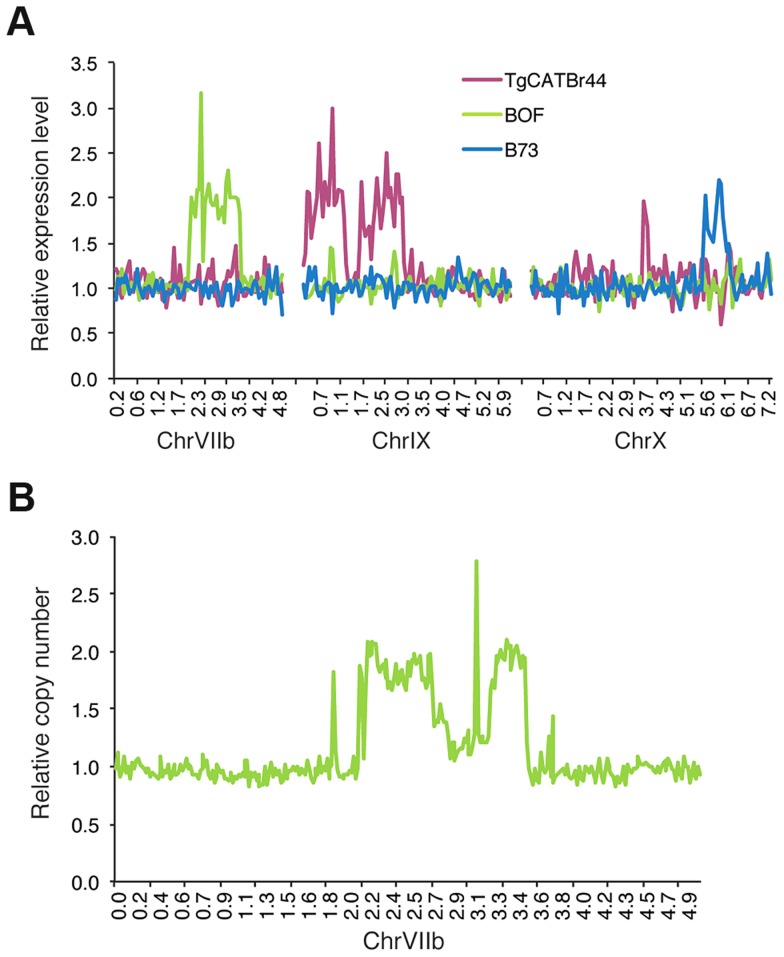
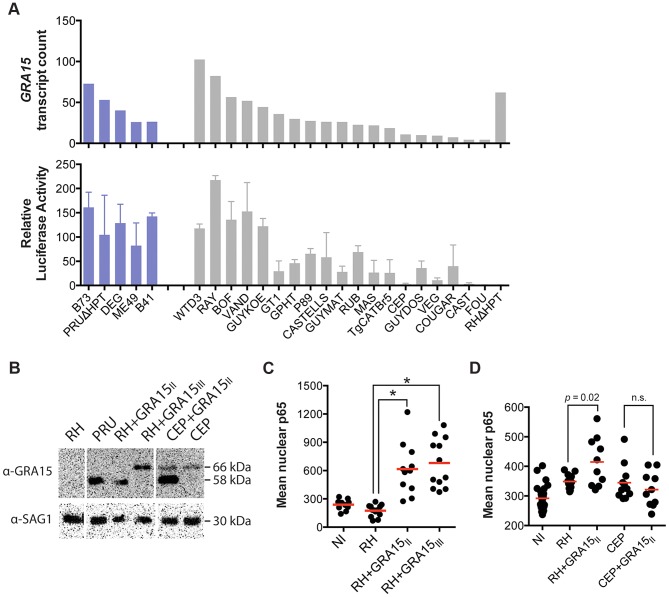
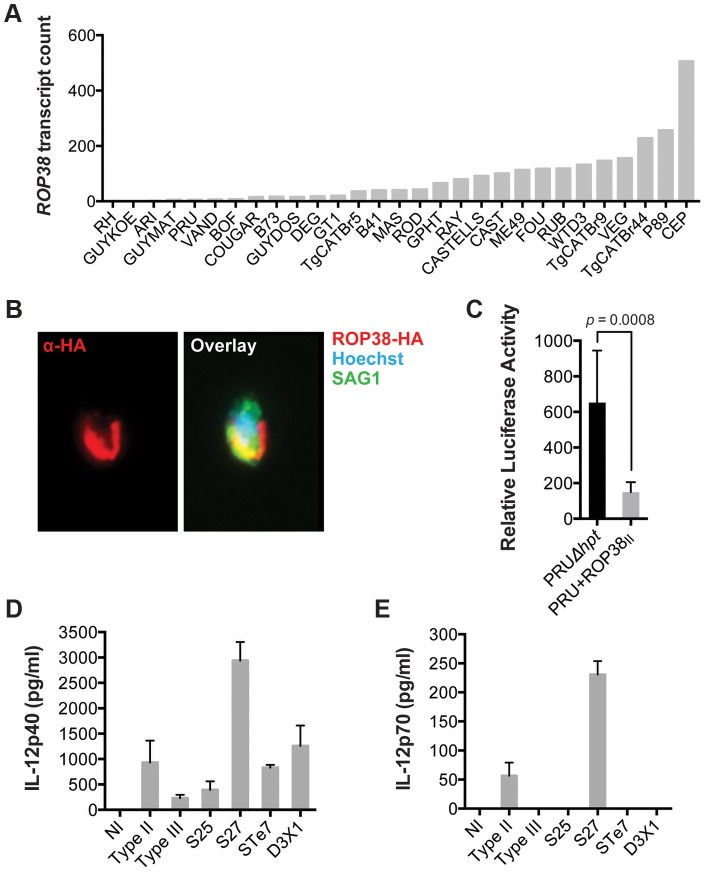
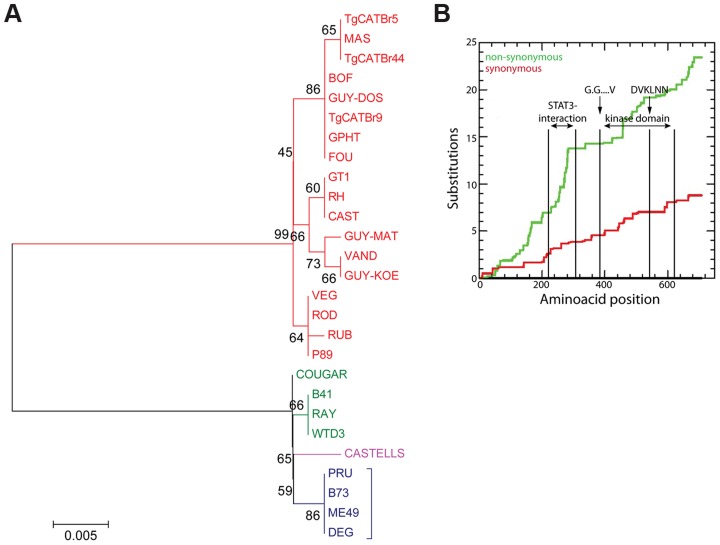
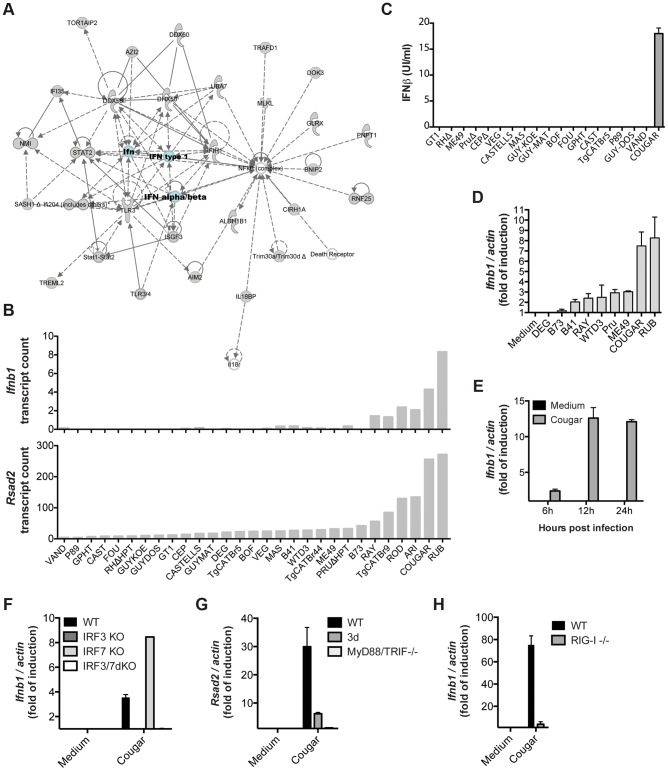
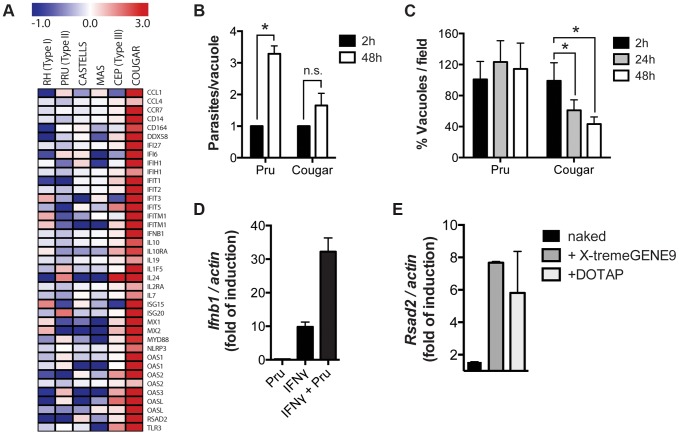
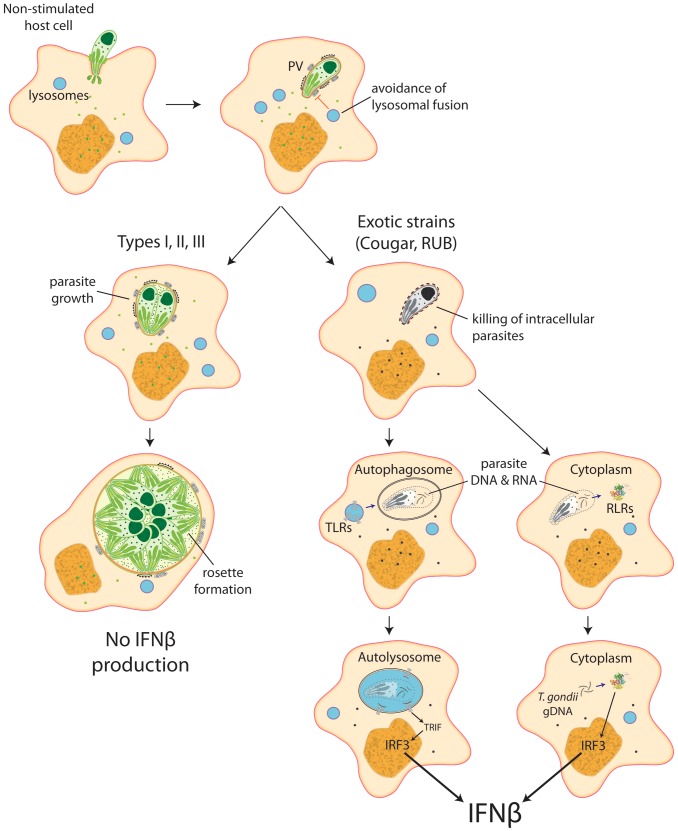
Most isolates of Toxoplasma from Europe and North America fall into one of three genetically distinct clonal lineages, the type I, II and III lineages. However, in South America these strains are rarely isolated and instead a great variety of other strains are found. T. gondii strains differ widely in a number of phenotypes in mice, such as virulence, persistence, oral infectivity, migratory capacity, induction of cytokine expression and modulation of host gene expression. The outcome of toxoplasmosis in patients is also variable and we hypothesize that, besides host and environmental factors, the genotype of the parasite strain plays a major role. The molecular basis for these differences in pathogenesis, especially in strains other than the clonal lineages, remains largely unexplored. Macrophages play an essential role in the early immune response against T. gondii and are also the cell type preferentially infected in vivo. To determine if non-canonical Toxoplasma strains have unique interactions with the host cell, we infected murine macrophages with 29 different Toxoplasma strains, representing global diversity, and used RNA-sequencing to determine host and parasite transcriptomes. We identified large differences between strains in the expression level of known parasite effectors and large chromosomal structural variation in some strains. We also identified novel strain-specifically regulated host pathways, including the regulation of the type I interferon response by some atypical strains. IFNβ production by infected cells was associated with parasite killing, independent of interferon gamma activation, and dependent on endosomal Toll-like receptors in macrophages and the cytoplasmic receptor retinoic acid-inducible gene 1 (RIG-I) in fibroblasts.


Conflict of interest statement

The authors have declared that no competing interests exist.

Figures

Figure 1
Figure 1. Transcriptome analysis of host cells infected with 29 Toxoplasma strains reveals clusters of co-regulated genes enriched in functional annotation.
(A–B) Representative heat maps are shown of differentially expressed mouse (A) or Toxoplasma gene clusters (B). Results of the analysis of enrichment in functional annotation using DiRE, GSEA, and Ingenuity Pathway Analysis are shown. (C) Example of clusters of co-regulated mouse genes that display high correlation with a cluster of Toxoplasma co-regulated genes. Other clusters are in Figures S2, S3 and details of the genes present in each cluster can be found in Table S1.
Figure 2
Figure 2. Genome-wide expression analysis uncovers strain-specific structural variations in Toxoplasma.
(A) Average relative gene expression of strains TgCATBr44, BOF and B73, as calculated by dividing that strain's gene expression by the median gene expression of all strains, plotted against the position in chromosomes VIIb, IX and X. (B) Relative number of reads obtained from BOF sequenced genome and mapped to ChrVIIb averaged over 15 kb intervals plotted against chromosomal positions.
Figure 3
Figure 3. Toxoplasma NFκB activation depends on both the expression levels and specific allele of dense granule protein GRA15.
(A) Top: GRA15 gene expression levels as determined by high-throughput RNA sequencing. Bottom: Indicated Toxoplasma strains were used to infect HEK293 cells stably expressing luciferase gene under the control of an NFκB promoter. 20 h post infection luciferase activity was measured in cell lysates. The relative luciferase activity was calculated by normalizing the raw luminescence values to the background. Data is average of at least three independent experiments. (B) Western blot on lysates of the indicated strains using an antibody against GRA15 detects the type II GRA15 (58 kDa) and the type I/III GRA15 (66 kDa). SAG1 antibody was used as parasite loading control. (C–D) Human foreskin fibroblasts where infected with the indicated strains of T. gondii for 24 hours, fixed and stained with α-NFκB (p65). Levels of nuclear p65 were quantified using NIS-Elements software (Nikon). NI = non-infected. Data is representative of two independent experiments.
Figure 4
Figure 4. ROP38 inhibits NFκB activation.
(A) Expression level of ROP38 in both control parasites (PRUΔhpt) and PRU transgenically expressing ROP38II, as detected by RNA sequencing. (B) Type II (PRU) parasites overexpressing HA-tagged ROP38 were used to infect monolayers of HFFs. After 3 h cells were fixed and stained with anti-HA to detect ROP38 (red), anti-SAG1 to detect parasites and Hoechst to detect parasite nucleus (blue). (C) HEK293 cells stably expressing luciferase under control of NFκB canonical promoter elements were infected with the indicated strains of Toxoplasma. 20 h post infection luciferase activity was measured in cell lysates. Data depicted is the combination of three independent experiments. (D–E) BMDM were infected for 24 h with a type II, III and F1 progeny from IIxIII crosses that contained type II GRA15 and ROP16 alleles (S25, S27, STE7, D3X1) and IL-12p40 (D) and IL12p35 (E) levels were detected in the supernatant using ELISA. Bars = standard error. Similar results were obtained in at least two independent experiments.
Figure 5
Figure 5. Evolutionary analysis of ROP16.
(A) Evolutionary bootstrap consensus tree of ROP16 was inferred from 500 replicates using the Neighbor-Joining method. The percentages of replicate trees in which the associated taxa clustered together in the bootstrap test (500 replicates) are shown next to the branches. The tree is drawn to scale, with branch lengths in the same units as those of the evolutionary distances used to infer the phylogenetic tree. The evolutionary distances were computed using the Poisson correction method and are in the units of the number of amino acid substitutions per site. Analyses were performed in MEGA5 software. (B) Cumulative behavior, codon by codon, of the average synonymous and non-synonymous substitutions rates of GRA15 alleles performed using the Synonymous Non-synonymous Analysis Program (SNAP, [83]). STAT3 interacting domain and kinase domain are indicated.
Figure 6
Figure 6. Strain-specific activation of the type I interferon signaling pathway.
(A) Ingenuity network based on the clustered genes is centered on IFNβ. (B) Expression levels of Ifnb (top) and Rsad2 (bottom) in BMDMs infected with the indicated strains of T. gondii for 20 h as determined by RNA sequencing. (C) Secretion of IFNβ protein by BMDMs into culture supernatants after infection with the indicated strains was detected 24 h post-infection by ELISA. (D) BMDMs were infected with indicated Toxoplasma strains for 24 h, and subsequently qPCR was used to detect Ifnb1. Relative expression levels were calculated by normalizing against actin expression. (E) BMDMs were infected with COUGAR and RNA isolated at the indicated time points. qPCR was used to detect Ifnb1. (F–H) Wild-type, IRF3, IRF7 and IRF3/IRF7 knockout immortalized macrophages (F), Unc93b1 triple-deficient mutant (3 d) and MyD88/TRIF double knockout immortalized macrophages (G), or wild-type and RIG-I knockout MEFs (H) were infected with COUGAR and qPCR was used to detect Ifnb1, Rsad2 and actin expression levels. Data is representative of three (C–D) or two (E–H) experiments yielding similar results.
Figure 7
Figure 7. Killing of intracellular parasites is associated with IFNβ production.
(A) Microarray analysis of HFFs shows differentially expressed host genes belonging to the type I interferon pathway (rows) induced during infection with different T. gondii strains (columns). (B–C) HFFs monolayers were infected with either PRU or COUGAR parasites for two hours, and subsequently washed to remove extracellular parasites. At the indicated time points cells were fixed, permeabilized, and stained with anti-SAG1 and anti-GRA7 to visualize parasites and vacuoles respectively. Number of parasites per cell (B) and vacuoles per field (C) was determined by counting at least 60 infected cells and 5 microscope fields per condition. Error bars represent standard error. Data is representative of three independent experiments. * = p<0.05. (D) HFFs monolayers where either pre-treated with IFNγ 100 u/ml for 24 hours or left untreated, and subsequently infected with T. gondii (PRU strain). After 20 hours of infection total RNA was isolated and expresion levels of Ifnb1 was determined by qPCR. Data is representative of experiments done two times. (E) Immortalized murine macrophages were stimulated overnight with 2.5 µg/ml of T. gondii genomic DNA or Poly(dA∶dT) either naked or conjugated with transfection reagents that delivers nucleic acids to the cytoplasm (X-tremeGENE9) or endosomal compartments (DOTAP). Subsequently total RNA was isolated and expression levels of Ifnb1 was determined by qPCR. Data is representative of two independent experiments.
Figure 8
Figure 8. Schematic model depicting induction of type I interferons by Toxoplasma.
Most parasite strains, when infecting resting, non-stimulated host cells, establish themselves in a parasitophorous vacuole that is permissive to parasite growth and do not induce IFNβ. Nevertheless, some atypical strains, like COUGAR and RUB, are killed right after formation of the parasitophorous vacuole, releasing parasite nucleic acid that can be captured by autophagossomes or released into the host cell cytoplasm, where it can interact with either Toll-like receptors or RIG-I-like receptors resulting in production of IFNβ.

References

    1. Dubremetz JF (1998) Host cell invasion by Toxoplasma gondii. Trends Microbiol 6: 27–30. - PubMed
    1. Hoffmann S, Batz MB, Morris JG Jr (2012) Annual cost of illness and quality-adjusted life year losses in the United States due to 14 foodborne pathogens. J Food Prot 75: 1292–1302. - PubMed
    1. Walker M, Zunt JR (2005) Parasitic central nervous system infections in immunocompromised hosts. Clin Infect Dis 40: 1005–1015. - PMC - PubMed
    1. Gilbert RE, Freeman K, Lago EG, Bahia-Oliveira LMG, Tan HK, et al. (2008) Ocular sequelae of congenital toxoplasmosis in Brazil compared with Europe. PLoS Negl Trop Dis 2: e277. - PMC - PubMed
    1. Jamieson SE, Peixoto-Rangel AL, Hargrave AC, Roubaix L-Ad, Mui EJ, et al. (2010) Evidence for associations between the purinergic receptor P2X(7) (P2RX7) and toxoplasmosis. Genes Immun 11: 374–383. - PMC - PubMed

Publication types