. 2013;9(12):e1003994.
doi: 10.1371/journal.pgen.1003994. Epub 2013 Dec 19.

Transcription factor occupancy can mediate active turnover of DNA methylation at regulatory regions

Affiliations

Transcription factor occupancy can mediate active turnover of DNA methylation at regulatory regions

Angelika Feldmann et al. PLoS Genet. 2013.

Abstract

Distal regulatory elements, including enhancers, play a critical role in regulating gene activity. Transcription factor binding to these elements correlates with Low Methylated Regions (LMRs) in a process that is poorly understood. Here we ask whether and how actual occupancy of DNA-binding factors is linked to DNA methylation at the level of individual molecules. Using CTCF as an example, we observe that frequency of binding correlates with the likelihood of a demethylated state and sites of low occupancy display heterogeneous DNA methylation within the CTCF motif. In line with a dynamic model of binding and DNA methylation turnover, we find that 5-hydroxymethylcytosine (5hmC), formed as an intermediate state of active demethylation, is enriched at LMRs in stem and somatic cells. Moreover, a significant fraction of changes in 5hmC during differentiation occurs at these regions, suggesting that transcription factor activity could be a key driver for active demethylation. Since deletion of CTCF is lethal for embryonic stem cells, we used genetic deletion of REST as another DNA-binding factor implicated in LMR formation to test this hypothesis. The absence of REST leads to a decrease of hydroxymethylation and a concomitant increase of DNA methylation at its binding sites. These data support a model where DNA-binding factors can mediate turnover of DNA methylation as an integral part of maintenance and reprogramming of regulatory regions.


Conflict of interest statement

The authors have declared that no competing interests exist.

Figures
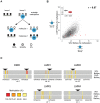
Figure 1
Figure 1. Relation between CTCF occupancy and methylation states in CpG poor regions.
(A) LMRs are bound by transcription factors (TF) and have intermediate average methylation levels. There are two possible scenarios how TF binding and DNA methylation at CpG poor regions could be linked. In a static situation (left), TF binding would be linked to the unmethylated state of the bound molecule, whereas unbound molecules are fully methylated as previously shown for imprinted CpG islands. In an unlinked model (right), TF binding is independent of the DNA methylation state, therefore bound molecules display the same variation of methylation levels as the entire population. (B) To distinguish these scenarios we enrich for bound molecules by ChIP and determine their methylation by bisulfite sequencing (ChIP-BisSeq). This results in a high correlation of methylation levels between ChIP-BisSeq (y-axis) and whole genome bisulfite sequencing (WG-BisSeq, x-axis). Each point represents average methylation over a 200 bp region. Shown are only regions centered at a bound CTCF motif which overlaps with an LMR and for which all considered cytosines have a minimal coverage of 10× in both, WG-BisSeq and ChIP-BisSeq. Red points represent average for 200 bp windows centered on CTCF motifs located within DMRs. Boxplots show mean deviation of methylation levels in ChIP-BisSeq from those in WG-BisSeq at LMRs and DMRs in percent methylation. (C) Examples of single cytosine methylation levels in WG-BisSeq (top bars) and ChIP-BisSeq (bottom bars). For LMRs a whole segment is shown. Each bar represents a cytosine. Methylation is shown in a color code (red: high, yellow: low). Position of CTCF motifs is indicated by black triangles. Only cytosines with at least 10× coverage in both, WG-BisSeq and ChIP-BisSeq, are shown.
Figure 2
Figure 2. Relationship between binding strength and DNA methylation within the CTCF motif.
(A) CTCF consensus motif used in this study . (B) Percent of predicted CTCF sites containing a CpG within the motif. Exclusively these CpGs are shown in the plots (C–E). (C–E) Each point represents one individual CpG within a CTCF motif. (C) Correlation of methylation and CTCF enrichment identifies three classes of CTCF sites: unbound (light-blue), strongly bound and unmethylated (dark-blue), weakly bound with intermediate levels of methylation (blue). The red line represents a running mean measurement of methylation. (D) Same as C, but only showing cytosines covered in both WG-BisSeq and CTCF ChIP-BisSeq. (E) Same as D but only showing methylation levels derived from CTCF ChIP-BisSeq. In each case bound molecules show the same pattern as the entire population. Only cytosines residing within the CTCF binding motif and with a minimal coverage of 10× are shown. In order to prevent over-plotting the points were jittered with a standard deviation of 2%.
Figure 3
Figure 3. 5hmC marks LMRs in a cell-type specific fashion.
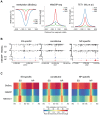
(A) Average profiles for methylation (WG-BisSeq), 5hmC (hMeDIP-seq) and TET1 occupancy at Fully Methylated, Unmethylated and Low Methylated Regions (FMRs, UMRs and LMRs, respectively) in ES cells. (B) DNA methylation (upper tracks) and enrichment of 5hmC (lower tracks) in ES cells and NP of representative ES-specific, constitutive and NP-specific LMRs. (C) Average profiles representing methylation (WG-BisSeq), hMeDIP-seq and H3K4me1 ChIP-Seq in ES cells and NP ±3 kb around the segment middle.
Figure 4
Figure 4. 5hmC dynamics during differentiation occurs preferentially at LMRs.
(A–B) Shown is the relative frequency of changes in 5hmC at LMRs and UMRs normalized for genome coverage at the ES (A) and NP state (B). The y-axis shows observed linear fold enrichment relative to expected enrichments (see Materials and Methods). Note that 5hmC is changing preferentially at cell-type specific LMRs.
Figure 5
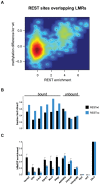
Figure 5. 5hmC enrichment at REST-bound LMRs is partially dependent on the presence of REST.
(A) Relative methylation changes between REST wildtype and REST knockout ES cells are correlated to REST ChIP enrichment. Methylation was determined 200 bp around the REST motif at all REST sites overlapping with LMRs. The point density is colour-coded (red: high, blue: low point density). Methylation determined by BisSeq (B) and hMeDIP qPCR enrichments (C) at REST motif containing LMRs bound and not bound by REST in wildtype (wt, dark blue) and REST knockout (ko, blue) ES cells. Error bars in (C) represent standard deviation in three replicate experiments normalized to a positive control.

Similar articles

Cited by

References

    1. Okita K, Ichisaka T, Yamanaka S (2007) Generation of germline-competent induced pluripotent stem cells. Nature 448: 313–317. - PubMed
    1. Silva J, Barrandon O, Nichols J, Kawaguchi J, Theunissen TW, et al. (2008) Promotion of reprogramming to ground state pluripotency by signal inhibition. PLoS Biol 6: e253. - PMC - PubMed
    1. Heintzman ND, Hon GC, Hawkins RD, Kheradpour P, Stark A, et al. (2009) Histone modifications at human enhancers reflect global cell-type-specific gene expression. Nature 459: 108–112. - PMC - PubMed
    1. Rada-Iglesias A, Bajpai R, Swigut T, Brugmann SA, Flynn RA, et al. (2011) A unique chromatin signature uncovers early developmental enhancers in humans. Nature 470: 279–283. - PMC - PubMed
    1. Lupien M, Eeckhoute J, Meyer CA, Wang Q, Zhang Y, et al. (2008) FoxA1 translates epigenetic signatures into enhancer-driven lineage-specific transcription. Cell 132: 958–970. - PMC - PubMed

Publication types

MeSH terms