. 2013 Dec 5:7:248.
doi: 10.3389/fncel.2013.00248. eCollection 2013.

Regulation of action potential delays via voltage-gated potassium Kv1.1 channels in dentate granule cells during hippocampal epilepsy

Affiliations

Regulation of action potential delays via voltage-gated potassium Kv1.1 channels in dentate granule cells during hippocampal epilepsy

Florian Kirchheim et al. Front Cell Neurosci. .

Abstract

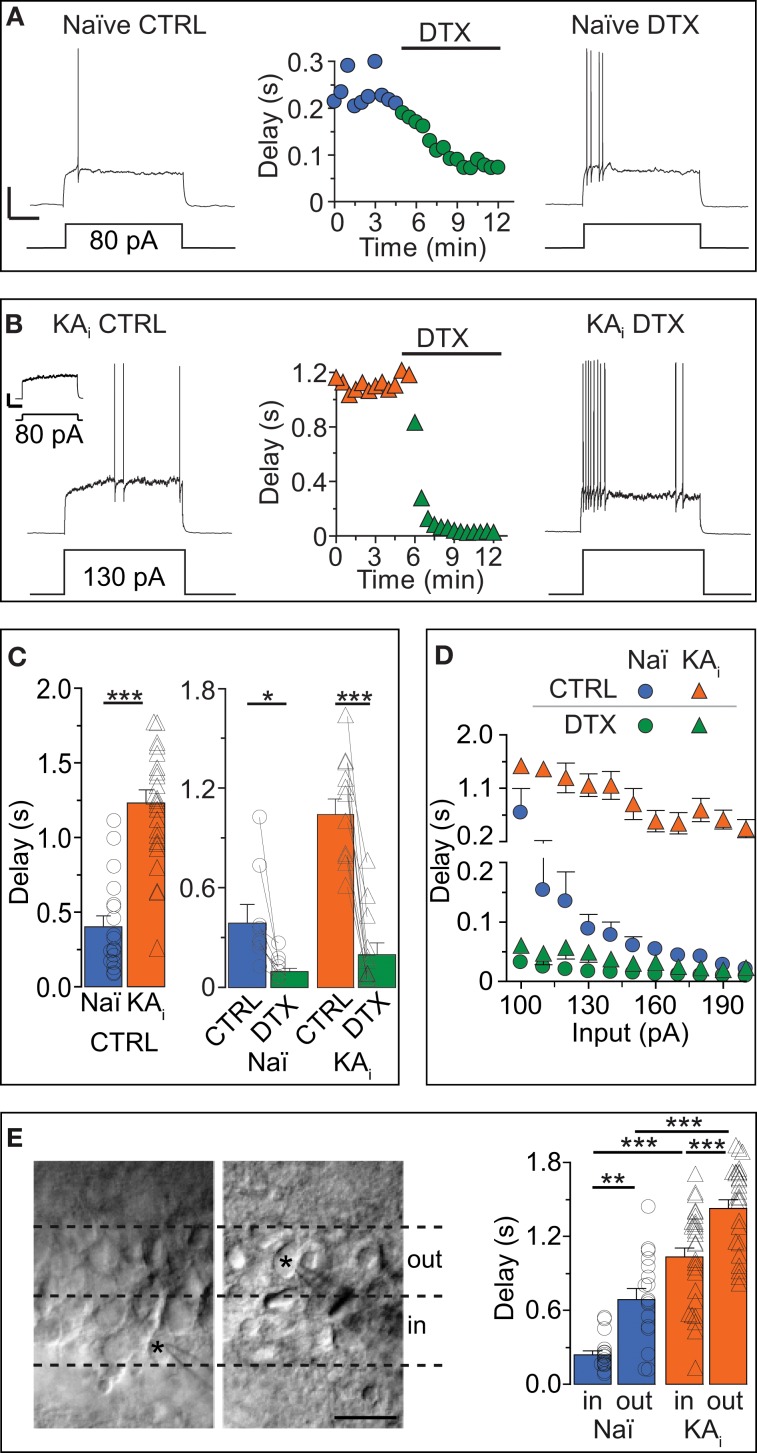
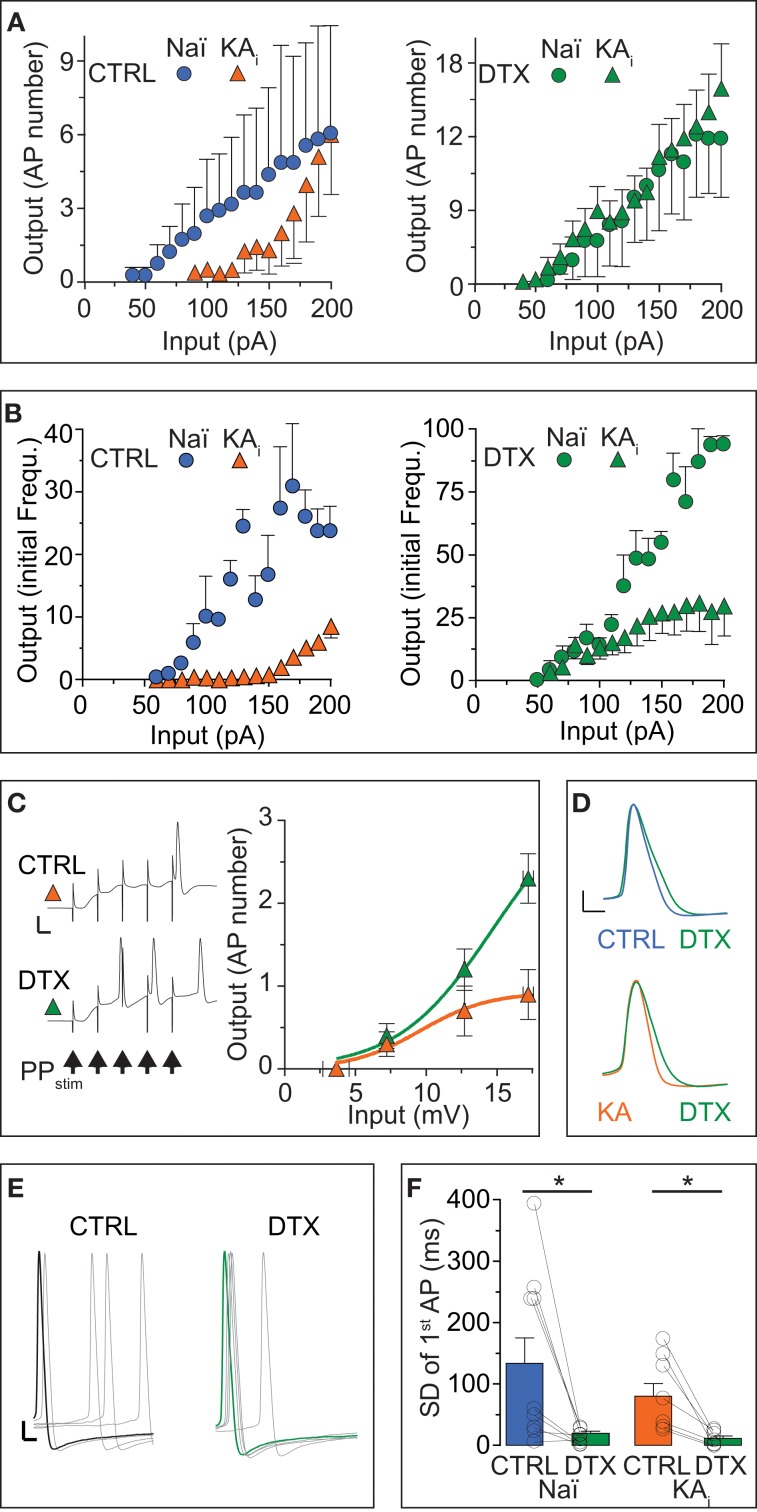
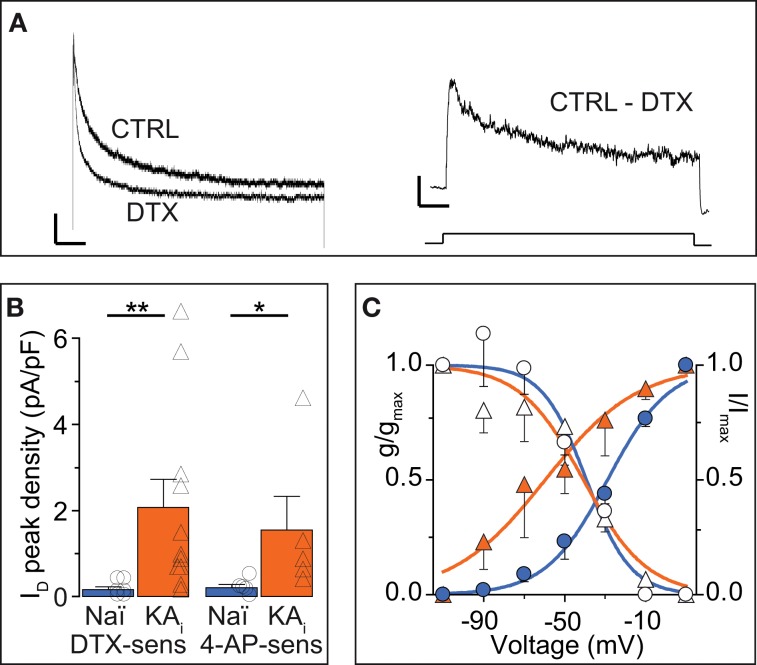
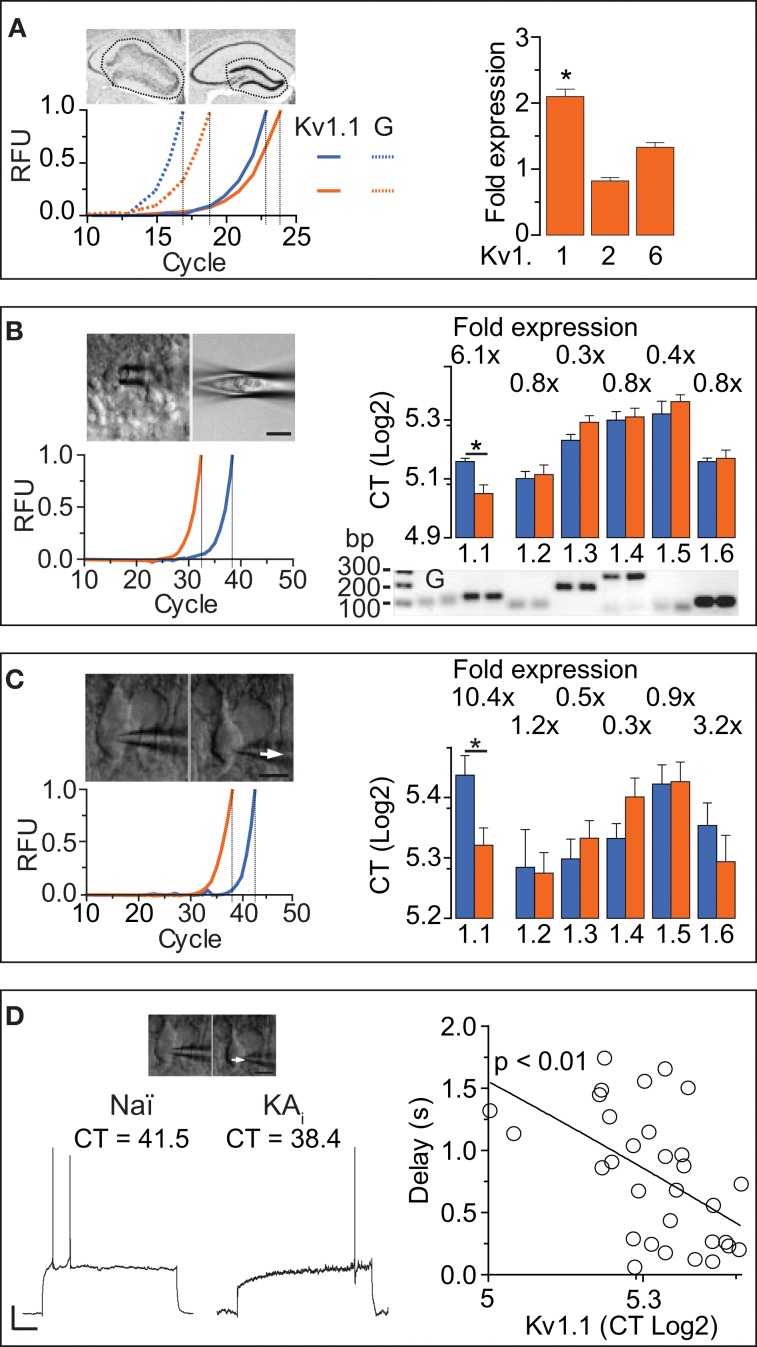
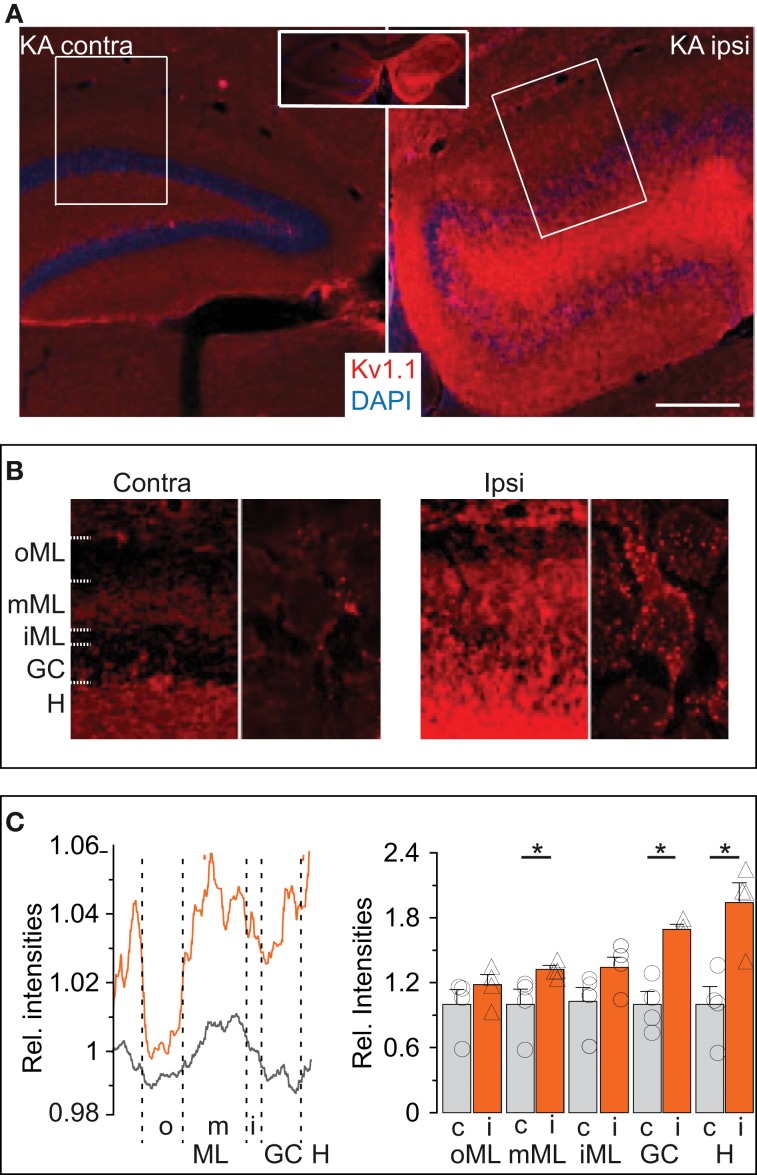
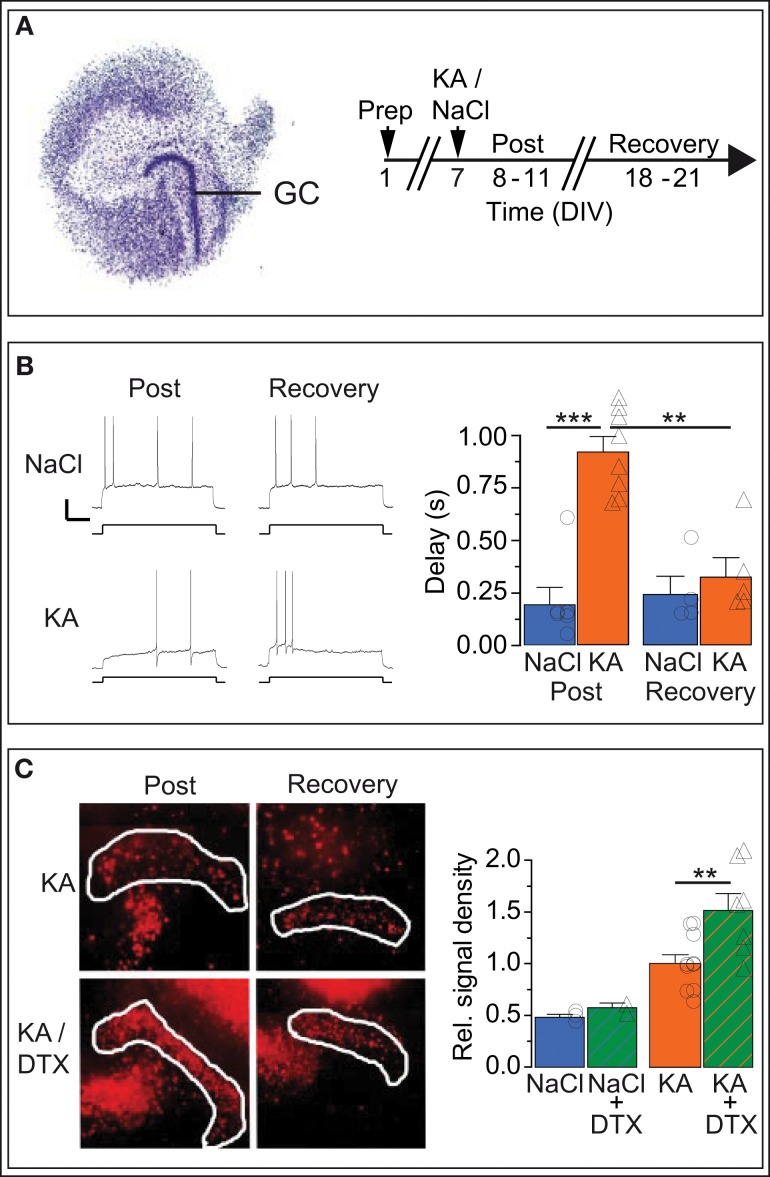
Action potential (AP) responses of dentate gyrus granule (DG) cells have to be tightly regulated to maintain hippocampal function. However, which ion channels control the response delay of DG cells is not known. In some neuron types, spike latency is influenced by a dendrotoxin (DTX)-sensitive delay current (ID) mediated by unidentified combinations of voltage-gated K(+) (Kv) channels of the Kv1 family Kv1.1-6. In DG cells, the ID has not been characterized and its molecular basis is unknown. The response phenotype of mature DG cells is usually considered homogenous but intrinsic plasticity likely occurs in particular in conditions of hyperexcitability, for example during temporal lobe epilepsy (TLE). In this study, we examined response delays of DG cells and underlying ion channel molecules by employing a combination of gramicidin-perforated patch-clamp recordings in acute brain slices and single-cell reverse transcriptase quantitative polymerase chain reaction (SC RT-qPCR) experiments. An in vivo mouse model of TLE consisting of intrahippocampal kainate (KA) injection was used to examine epilepsy-related plasticity. Response delays of DG cells were DTX-sensitive and strongly increased in KA-injected hippocampi; Kv1.1 mRNA was elevated 10-fold, and the response delays correlated with Kv1.1 mRNA abundance on the single cell level. Other Kv1 subunits did not show overt changes in mRNA levels. Kv1.1 immunolabeling was enhanced in KA DG cells. The biophysical properties of ID and a delay heterogeneity within the DG cell population was characterized. Using organotypic hippocampal slice cultures (OHCs), where KA incubation also induced ID upregulation, the homeostatic reversibility and neuroprotective potential for DG cells were tested. In summary, the AP timing of DG cells is effectively controlled via scaling of Kv1.1 subunit transcription. With this antiepileptic mechanism, DG cells delay their responses during hyperexcitation.

Keywords: KD; Kcna1; hippocampus; homeostasis; homeostatic plasticity; shaker-related.


Figures

Figure 1
Figure 1
Dendrotoxin (DTX)-sensitive action potential response delays in DG cells of naïve mice and during hippocampal epilepsy. (A–C) Current-clamp recordings in DG cells of naïve [Naï, (A), circles] and KA-injected [KAi, (B), triangles] mice showing the transformation of a delayed action potential (AP) response under control condition (CTRL, left traces) into an almost immediate AP response by Kv1 channel blocker DTX (right traces). Because KA DG cells have a higher rheobase than Naï DG cells (Young et al., 2009), stronger current steps were injected into KA cells for pharmacological delay characterization [130 pA in (B)]. For direct comparison see inset in (B) [response of KA cell to current pulse as in (A), i.e., 80 pA]; Scale bars in (A,B) inset, 25 mV, 0.5 s. Compared to Naï DG cells, AP delays of KA DG cells were ~2.5 times prolonged (C). This was true with rheobase currents (C, right panel) and with current injections that were not statistically different (C, left panel). (D) Over a larger range of current injections, the response delays of KA DG cells were elevated (orange triangles) vs. Naï DG cells (blue circles) which displayed stronger response acceleration with increasing current injections. This difference was abolished with DTX (green triangles, KA; green circles, Naï, respectively). (E) Recorded DG cells localized via live fotos of patch pipettes (asterisks) were devided into inner DG cells (“in,” left panel, i.e., cells closer to the hilus outer) and outer DG cels (“out,” i.e., cells closer to the molecular layer). The grouping of recorded AP delays according to these areas (right panel) revealed on average longer delays in the outer DG cells from both naïve and KA-injected mice.
Figure 2
Figure 2
The input/output transfer function of DG cells is controlled by ID. (A,B) Action potential (AP) output evaluated by number (A) and initial frequency (B) was evoked by somatic DC input in DG cells from naïve mice (Naï, circles) and KA-injected mice (KA, triangles) under control (CTRL) conditions and after DTX application (green symbols). The input/output (I/O) curve was shifted to higher input values in KA vs. Naï cells [(A), left panel, compare orange triangles with blue circles, respectively]. Application of DTX reduced this difference [(A,B), right panels, compare green triangles with green circles, respectively], although with higher input, the AP frequency did not reach naïve levels. (C) To test the effect of increased DTX-sensitive conductance on dendritic signal integration, the above changes in I/O curves were additionally verified with extracellular perforant path stimulation (5 pulses at 100 Hz, arrows in left panel) evoking excitatory postsynaptic synaptic potentials (EPSPs) in KA cells of which the first was measured as input (no such additional verification was performed in naïve cells). Synaptic input triggered no more than one AP at the end of five summating EPSPs in CTRL conditions (upper trace and orange triangles, respectively; scale bars, 20 mV, 50 ms). However, application of DTX shifted the I/O curve to lower input values and allows multiple APs to occur (lower trace, green triangles). (D–F) Application of DTX increased the AP width (D) and 1st AP precision (E,F) of the AP response to DC steps in Naï and KA DG cells. The AP jitter evaluated as SD of first spike (see Results for CV). Scale bars in (D), 10 mV, 1 ms; (E) 10 mV, 2 ms.
Figure 3
Figure 3
Voltage-clamp characterization of the ID of DG cells. (A) Dendrotoxin (DTX, 100 nM)-sensitive currents (ID) were obtained in voltage-clamp by offline subtraction of currents after DTX application from those before (CTRL). Scale bars, 500 ms, left panel, 100 pA, right panel, 50 pA. Lower panel, 2.5 s-long voltage step from −100 to 0 mV). (B) Peak ID current densities from experiments as in A using DTX and 40 μM 4-AP. The DG cells of KA-injected hippocampi had strongly increased DTX- and 40 μM 4-AP-sensitive ID amplitudes. (C) To determine the voltage dependence of activation, the DTX-sensitive ID was evoked by voltage steps from −110 to +10 mV (filled symbols, left y-axis), transformed into conductance (g) and a Boltzmann function was fitted [VAct(0.5), naïve, ‒32.3 ± 1.9 mV, slope, 17.1, n = 7; KA, ‒46.0 ± 2.3 mV, slope, 17.0, n = 7, p < 0.001]. To determine voltage dependence of inactivation, prepulses from −110 to +10 mV (empty symbols, right y-axis) were applied prior to the test pulse (+10 mV) and normalized ID amplitudes were fitted to a Boltzmann function [VInact(0.5): Naï, −41.7 mV, slope, 14.1; KA, −43.8 mV, slope, 13.7].
Figure 4
Figure 4
RT-qPCR reveals that Kv1.1 channel subunits mediate the ID increased in DG cells during hippocampal epilepsy. (A) In a first RT-qPCR approach, whole DGs were dissected from acute brain slices and expression levels of Kv1.1, Kv1.2, and Kv1.6 were measured relative to GAPDH [left upper panels: scheme of dissection; left lower panel, solid lines: red, naïve; blue, KA; dashed lines: GAPDH; RFU, relative fluorescence units; traces normalized to cycle threshold (CT)]. In the right panel, the relative expression levels of Kv subunits were statistically compared between KA and control tissue (not shown). Kv1.1 was expressed ~2 fold in the epileptic DG, while Kv1.2, and Kv1.6 were not significantly different (in KA vs. control tissue). (B) DG cell somata were collected into the pipette in a “pearl” fashion (see Methods, left upper panels) and mRNA reverse transcribed to cDNA which was subjected to qPCR. Real time amplification of Kv1.1 (left lower panel; blue, naïve; orange, KA). The amplified PCR products of Kv1.1, Kv1.2, Kv1.3, Kv1.4, Kv1.5, and Kv1.6 subunits, and GAPDH (G) had the expected fragment sizes as revealed by quantitative gel electrophoresis (right lower panel; bp, base pairs). Relative to naïve DG cells, expression levels of Kv1.1 subunits were increased in KA samples, while Kv1.2, Kv1.3, Kv1.4, Kv1.5, and Kv1.6 abundance was not significantly changed (right upper panel). (C,D) In a second approach, true single-cell (SC) RT-qPCR experiments were performed from individual cell cytosol harvested (arrows) in patch-clamp recordings (C, left upper panel). Amplification and evaluation of Kv1.1–6 subunits in SC RT-qPCR (C, left lower panel) was performed as in (B). To circumvent the effect of the non-physiological pipette solution, gramicidin-perforated recordings (D, left panel) were performed prior to membrane rupture. In these experiments, KA cells expressed ~10-fold more Kv1.1 subunits compared to naïve cells, while levels of other Kv1 subunits were again not different (C, right panel). Importantly, the AP response delays correlated with the levels of Kv1.1 expression in the respective pooled naïve (Naï) and KA cells [(D), right panel; r = 0.98, n = 32, p < 0.01].
Figure 5
Figure 5
Expression of Kv1.1 proteins is more abundant in the KA-injected hippocampi. (A) Overview (inset, both hemispheres) of immunofluorescence labeling of Kv1.1 channel proteins (red) strongly enhanced in the (ipsilateral, Ipsi) KA-injected hippocampus compared to the non-injected (contralateral, Contra) side. Sections were co-labelled with DAPI (blue). Scale bar, 500 μm. (B) Magnified regions of interest acquired with identical microscope settings (left panels of Contra and Ipsi, ROIs boxed in (A) respectively; right panels, further magnified single cells, respectively). Contralateral Kv1.1 signal intensities were larger in the hilus (H) and middle molecular layer (mML, see Results) compared to the DG cell soma layer (GC) as well as outer and inner ML (oML, iML, respectively). Ipsilateral Kv1.1 signals also formed a band in the mML, but in addition showed strong Kv1.1 labeling in the GC, iML and H. At higher magnification, contralateral DG cells show little Kv1.1 in the GC layer (right panels in Contra and Ipsi). However, the KA side shows abundant Kv1.1 punctae decorating DG somata which may belong to somatodendritic membranes of DG cells or backsprouted mossy fibers (Ipsi, right panel). (C) Relative quantification of Kv1.1 fluorescence intensities by line profiles (left panel) or surface areas (right panel) from ROIs as in (B). The line profile (left panel) shows a distinctive band in the mML contra- and ipsilateral. The relative amount of Kv1.1 signal is enhanced ipsilateral in almost all dentate regions.
Figure 6
Figure 6
In vitro KA model: Kv1.1 channel upregulation in DG cells is reversible and neuroprotective. (A) Organotypic hippocampal slice cultures (OHCs) prepared from P2 mouse pups were treated after 7 days in vitro (DIV) either with normal medium (NaCl) or with 15 μM kainate (KA). Time-matched results were pooled into two periods: the acute post-KA (or post-NaCl) period (8–11 DIV) and the recovery period (18–21 DIV). (B) The AP response delays of cultured DG cells were strongly enhanced in KA vs. control slices during the acute period (compare upper and lower Post-traces, and blue Post-NaCl and orange Post-KA bars, respectively). Importantly, during the recovery period, the response delays of KA-incubated slices returned to small NaCl-like values (compare upper and lower Recovery traces and orange Post-KA and orange Recovery-KA bars, respectively). Scale bars, 20 mV, 0.5 s. Current steps: NaCl, 70 pA; KA, 40 pA. (C) Staining with propidium iodide (PI), a cell death marker, showed that KA induced widespread cell death of hippocampal cells (left, Post-KA subpanel), which was quantified in the DG cell layer (white border, see Methods). The addition of Kv1 blocker DTX in the acute phase only mildly affected cell death under control conditions (NaCl, NaCl/DTX) but led to a massive increase in cell death in the DG cell layer (left panel, Post-KA/DTX subpanel, and right panel). These results indicate that the presence of functional Kv1 channels has a neuroprotective effect for DG cells.

Similar articles

Cited by

References

    1. Alme C. B., Buzzetti R. A., Marrone D. F., Leutgeb J. K., Chawla M. K., Schaner M. J., et al. (2010). Hippocampal granule cells opt for early retirement. Hippocampus 20, 1109–1123 10.1002/hipo.20810 - DOI - PubMed
    1. Bausch S. B., McNamara J. O. (2004). Contributions of mossy fiber and CA1 pyramidal cell sprouting to dentate granule cell hyperexcitability in kainic acid-treated hippocampal slice cultures. J. Neurophysiol. 92, 3582–3595 10.1152/jn.01028.2003 - DOI - PubMed
    1. Beck H., Blumcke I., Kral T., Clusmann H., Schramm J., Wiestler O. D., et al. (1996). Properties of a delayed rectifier potassium current in dentate granule cells isolated from the hippocampus of patients with chronic temporal lobe epilepsy. Epilepsia 37, 892–901 10.1111/j.1528-1157.1996.tb00043.x - DOI - PubMed
    1. Beck H., Clusmann H., Kral T., Schramm J., Heinemann U., Elger C. E. (1997). Potassium currents in acutely isolated human hippocampal dentate granule cells. J. Physiol. 498(Pt 1), 73–85 - PMC - PubMed
    1. Beck H., Ficker E., Heinemann U. (1992). Properties of two voltage-activated potassium currents in acutely isolated juvenile rat dentate gyrus granule cells. J. Neurophysiol. 68, 2086–2099 - PubMed

LinkOut - more resources