. 2013 Dec 6:7:184.
doi: 10.3389/fncir.2013.00184. eCollection 2013.

Delivery of continuously-varying stimuli using channelrhodopsin-2

Affiliations

Delivery of continuously-varying stimuli using channelrhodopsin-2

Tatjana Tchumatchenko et al. Front Neural Circuits. .

Abstract

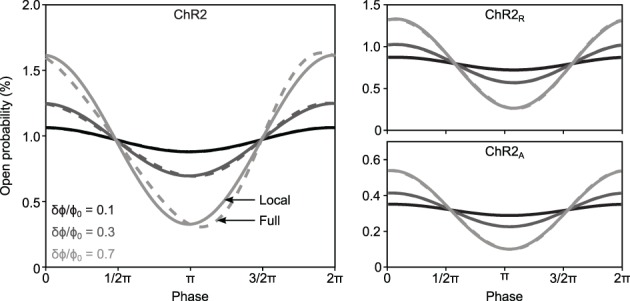
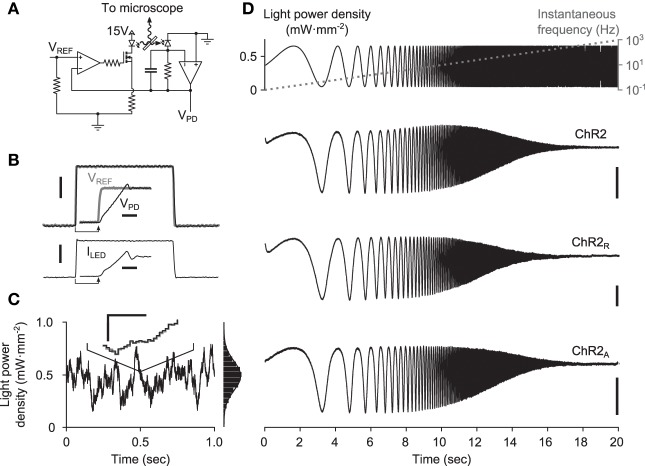
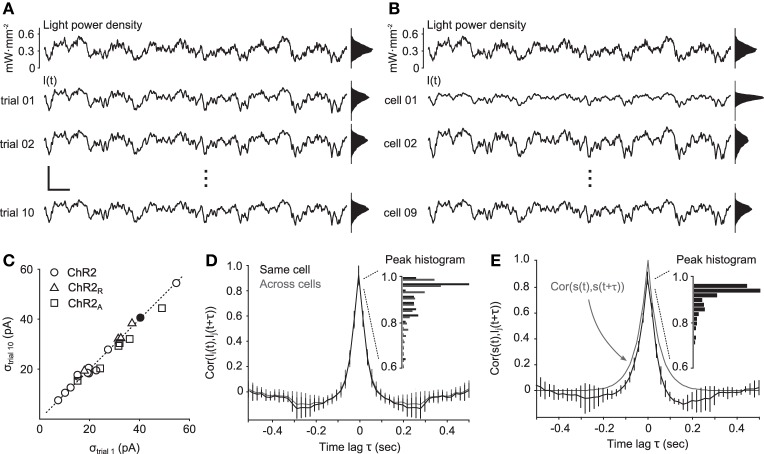
To study sensory processing, stimuli are delivered to the sensory organs of animals and evoked neural activity is recorded downstream. However, noise and uncontrolled modulatory input can interfere with repeatable delivery of sensory stimuli to higher brain regions. Here we show how channelrhodopsin-2 (ChR2) can be used to deliver continuous, subthreshold, time-varying currents to neurons at any point along the sensory-motor pathway. To do this, we first deduce the frequency response function of ChR2 using a Markov model of channel kinetics. We then confirm ChR2's frequency response characteristics using continuously-varying optical stimulation of neurons that express one of three ChR2 variants. We find that wild-type ChR2 and the E123T/H134R mutant ("CheTA") can pass continuously-varying subthreshold stimuli with frequencies up to ~70 Hz. Additionally, we find that wild-type ChR2 exhibits a strong resonance at ~6-10 Hz. Together, these results indicate that ChR2-derived optogenetic tools are useful for delivering highly repeatable artificial stimuli that mimic in vivo synaptic bombardment.

Keywords: channelrhodopsin-2; circuit dynamics; dynamical systems; electrophysiology methods; linear response theory; networks and dynamical systems; neural circuits; optogenetics.


Figures

Figure 1
Figure 1
ChR2's amplitude response function. (A) Illustration of the three-state Markov channel model described by Equations 1–3. The transition rates between open, O, desensitized, D, and closed, C, states are ϵϕ(t), Γr, and Γd, respectively. (B) Amplitude response functions |FChR2(2πf)| for the model are shown for three ChR2 variants using different mean illumination intensities (0.15–0.6 mW·mm−2) and parameters in Table 1. (C) Voltage dependence of ChR2's amplitude response function. ChR2 and ChR2R both have a voltage-dependent desensitization rate, Γd(v), which results in decreased bandwidth as the membrane potential increases. ChR2A does not have a voltage dependent desensitization rate and therefore has a stable bandwidth across membrane potentials. (D) Predicted amplitude response of each ChR2 variant compared to the experimentally measured response for a mean illumination intensity of 0.35 mW·mm−2. Error bars are ±1 STD.
Figure 2
Figure 2
FChR2(ω)'s linear time-invariant response versus complete model dynamics for different ChR2 variants. The time-invariant FChR2(ω) approximation (solid lines) and the complete dynamics (dashed lines) of O(t) are shown in response to 5 Hz sinusoidal stimuli for ChR2 (left), ChR2R (right, top) and ChR2A (right, bottom). Gray shades represent different sinusoidal amplitudes normalized to the mean stimulus intensity, δϕ/ϕ0 = 0.1, 0.3, and 0.7.
Figure 3
Figure 3
Delivery of continuously-varying stimuli to neurons using ChR2. (A) Simplified schematic of the LED driver in optical feedback mode. The circuit uses an amplified photodiode to compensate for the non-linearities and temperature dependence of the LED, allowing arbitrary waveforms to be delivered to cells. (B) A 1-ms LED pulse, VPD (black), versus the reference voltage, VREF (gray). The current sourced to the LED is shown in the lower plot. Scale bars, 1 mW·mm−2 (top) and 250 mA (bottom). Insets show the zoomed step onset with corresponding 5 μs scale bars. (C) A computer generated Gaussian stimulus (gray) signal and the recorded light waveform (black). The lines overlap almost perfectly, making the reference voltage (gray) difficult to see. An inset shows a zoomed portion of the sequence. Scale bars, 0.05 mW·mm−2 and 500 μs. An amplitude histogram of the sequence, with a best-fit Gaussian distribution, is shown to the right. (D) Responses to frequency chirp stimuli for each ChR2 variant tested. The top plot shows the stimulus waveform (black) along with the instantaneous frequency profile (gray) and bottom plots show evoked current waveforms. Scale bars, 100 pA.
Figure 4
Figure 4
Reliability of continuously-varying neuronal photostimulation. (A) Intracellular currents from a single cell during Gaussian stimuli. The top trace is a portion of a 10-s Gaussian stimulus sequence. The bottom three traces show the intracellular currents recorded during different presentations of the same stimulus waveform. Scale bars, 200 pA and 200 ms. Scale bars apply to all time series traces in the figure. (B) The same stimulus waveform used in (A), and the corresponding evoked responses from different cells. (C) The standard deviation of the photocurrent induced on the first trial of stimulation versus on the last trial. The dotted line is identity. Points near the identity line indicate that there was little or no decrease in stimulus efficacy across trials. The filled dot corresponds to the cell in (A). (D) Normalized cross-correlation functions of photocurrents between neurons (gray) or autocorrelation function of photocurrents within the same neuron (black). The inset shows a histogram of peak correlation coefficients. (E) Normalized cross-correlation function between the stimulation process s(t) and recorded photocurrents. The gray line is the autocorrelation function of the stimulation process. The inset shows a histogram of peak correlation coefficients. Unless otherwise noted, data in this figure were obtained from cells expressing ChR2.

Similar articles

Cited by

References

    1. Arabzadeh E., Petersen R. S., Diamond M. E. (2003). Encoding of whisker vibration by rat barrel cortex neurons: implications for texture discrimination. J. Neurosci. 23, 9146–9154 Available online at: http://www.jneurosci.org/content/23/27/9146.full - PMC - PubMed
    1. Azouz R., Gray C. M. (2000). Dynamic spike threshold reveals a mechanism for synaptic coincidence detection in cortical neurons in vivo. PNAS 97, 8110–8115 10.1073/pnas.130200797 - DOI - PMC - PubMed
    1. Berndt A., Schoenenberger P., Mattis J., Tye K. M., Deisseroth K., Hegemann P., et al. (2011). High-efficiency channelrhodopsins for fast neuronal stimulation at low light levels. PNAS 108, 7595–7600 10.1073/pnas.1017210108 - DOI - PMC - PubMed
    1. Boyden E. S., Zhang F., Bamberg E., Nagel G., Deisseroth K. (2005). Millisecond-timescale, genetically targeted optical control of neural activity. Nat. Neurosci. 8, 1263–1268 10.1038/nn1525 - DOI - PubMed
    1. Cardin J., Carlen M., Meletis K., Knoblich U., Zhang F., Deisseroth K., et al. (2009). Driving fast-spiking cells induces gamma rhythm and controls sensory responses. Nature 459, 663–667 10.1038/nature08002 - DOI - PMC - PubMed

Publication types

Substances