Review
. 2013 Dec 5:7:193.
doi: 10.3389/fncir.2013.00193.

Methods for recording and measuring tonic GABAA receptor-mediated inhibition

Affiliations
Review

Methods for recording and measuring tonic GABAA receptor-mediated inhibition

Damian P Bright et al. Front Neural Circuits. .

Abstract

Tonic inhibitory conductances mediated by GABAA receptors have now been identified and characterized in many different brain regions. Most experimental studies of tonic GABAergic inhibition have been carried out using acute brain slice preparations but tonic currents have been recorded under a variety of different conditions. This diversity of recording conditions is likely to impact upon many of the factors responsible for controlling tonic inhibition and can make comparison between different studies difficult. In this review, we will firstly consider how various experimental conditions, including age of animal, recording temperature and solution composition, are likely to influence tonic GABAA conductances. We will then consider some technical considerations related to how the tonic conductance is measured and subsequently analyzed, including how the use of current noise may provide a complementary and reliable method for quantifying changes in tonic current.

Keywords: GABAA; extrasynaptic; methods; noise; tonic inhibition.


Figures
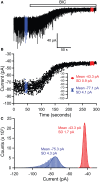
Figure 1
Figure 1
Methods of measuring tonic GABA current shifts. (A) Example current trace recorded from a thalamic relay neuron illustrating block of sIPSCs by application of bicuculline (BIC) and the simultaneous block of a tonic GABA current, revealed by the outward shift in the holding current. Epochs used to define the holding current under control and bicuculline conditions are illustrated in blue and red respectively. (B) The holding current is sampled by averaging over 5 ms at 100 ms intervals. Any of these baseline points falling on the decay of a sIPSC are omitted, before plotting against time to give the current-time plot shown. Values for the current in control and bicuculline are then calculated by averaging over the 10 s long epochs shown in blue and red respectively—these mean values are shown in the inset. Using this method, the tonic current is 77.1 − 43.3 = 33.8 pA. (C) The tonic current can also be defined by generating all-points histograms for the control and bicuculline epochs and then fitting Gaussian curves to the positive side of these histograms. The mean values from the Gaussian fits are then used to define the currents in control and bicuculline. This method thus gives a tonic current of 75.3 − 43.3 = 32 pA.
Figure 2
Figure 2
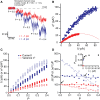
Effects of changing open probability P on simulated tonic current and noise. (A) Simulated “noisy” currents generated by using a simple 2-state model in WinEDR. Simulation parameters used for the ion channels were number of channels N = 100 and open time constant τ = 1 ms with a background noise of 2 pA. Open probability P was increased from 0 to 0.4 in 0.025 increments of which only selected values are shown. Example currents are shown for single channel currents i = −1 and −2 pA. (B) Plots of the mean current I against variance σ2 illustrate the expected parabolic relationship—data points are fitted well with equation (3). (C) Plots of mean current I and variance σ2 against open probability P for the two selected single channel currents. (D) The slopes of the I-P and σ2-P plots were calculated (ΔI/ΔP and Δσ2P) and plotted against P. Linear regression was performed on the slope plots (solid lines for ΔIP and dashed lines for Δσ2P) and the points of intersection between these lines are indicated by the arrows. The P value at these points of intersection, Pintercept is plotted against the single channel current (inset).
Figure 3
Figure 3
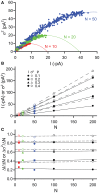
Effects of changing channel number N on simulated tonic current and noise. Simulated currents were generated in WinEDR to investigate the impact of changing channel number N on current and variance. Open probability P was increased from 0 to 0.4 in 0.025 increments (A) Plots of the mean current I against variance σ2 for N = 10, 20, & 50 illustrate the expected parabolic relationship—data points are fitted well with equation (3). (B) Plots of mean current I (filled symbols, solid lines) and variance σ2(open symbols, dashed lines) against channel number N for P values of 0.1, 0.2, 0.3, & 0.4. (C) The slopes of the I-N and σ2-N plots were calculated (ΔIN, filled symbols and Δσ2N, open symbols) and plotted against N. Linear regression was performed on the slope plots (solid lines for ΔIN and dashed lines for Δσ2N). The slopes are constant for both current and variance but for a given P value, Δσ2N is always greater than ΔIN.
Figure 4
Figure 4
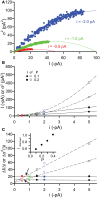
Effects of changing single channel current i on simulated tonic current and noise. Simulated currents were generated in WinEDR to investigate the impact of changing single channel current i on current and variance. Open probability P was increased from 0 to 0.4 in 0.025 increments with a fixed number of channels N = 100. (A) Plots of the mean current I against variance σ2 for i = −0.5, −1, & −2 pA illustrate the expected parabolic relationship—data points are fitted well with equation (3). (B) Plots of mean current I (filled symbols, solid lines are linear fits to data points) and variance σ2 (open symbols, dashed lines represent fitting of a quadratic equation to the data points) against single channel current i for P values of 0.1 & 0.2. (C) The slopes of the I-i and σ2-i plots were calculated (ΔIi, filled symbols and Δσ2i, open symbols) and plotted against i. Linear regression was performed on the slope plots (solid lines for ΔIi and dashed lines for Δσ2i) and the points of intersection between these lines are indicated by the arrows. The i value at these points of intersection, iintercept is plotted against the open probability P (inset).

Similar articles

Cited by

References

    1. Abramian A. M., Comenencia-Ortiz E., Vithlani M., Tretter E. V., Sieghart W., Davies P. A., et al. (2010). Protein kinase C phosphorylation regulates membrane insertion of GABAA receptor subtypes that mediate tonic inhibition. J. Biol. Chem. 285, 41795–41805 10.1074/jbc.M110.149229 - DOI - PMC - PubMed
    1. Adkins C. E., Pillai G. V., Kerby J., Bonnert T. P., Haldon C., McKernan R. M., et al. (2001). α4β3δ GABAA receptors characterized by fluorescence resonance energy transfer-derived measurements of membrane potential. J. Biol. Chem. 276, 38934–38939 10.1074/jbc.M104318200 - DOI - PubMed
    1. Akaike N., Yakushiji T., Tokutomi N., Carpenter D. O. (1987). Multiple mechanisms of antagonism of gamma-aminobutyric acid (GABA) responses. Cell Mol. Neurobiol. 7, 97–103 10.1007/BF00734993 - DOI - PMC - PubMed
    1. Amato A., Connolly C. N., Moss S. J., Smart T. G. (1999). Modulation of neuronal and recombinant GABAA receptors by redox reagents. J. Physiol. 517, 35–50 10.1111/j.1469-7793.1999.0035z.x - DOI - PMC - PubMed
    1. Arancibia-Carcamo I. L., Kittler J. T. (2009). Regulation of GABAA receptor membrane trafficking and synaptic localization. Pharmacol. Ther. 123, 17–31 10.1016/j.pharmthera.2009.03.012 - DOI - PubMed

MeSH terms

Substances

LinkOut - more resources