. 2013 Dec 9:7:103.
doi: 10.3389/fnsys.2013.00103. eCollection 2013.

Spatiotemporal receptive field structures in retinogeniculate connections of cat

Affiliations

Spatiotemporal receptive field structures in retinogeniculate connections of cat

Naofumi Suematsu et al. Front Syst Neurosci. .

Abstract

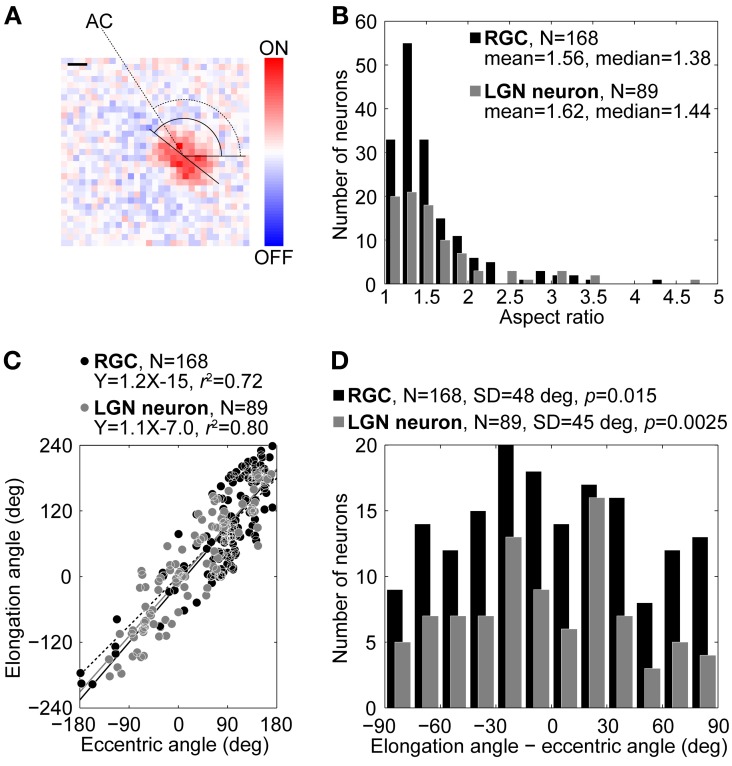
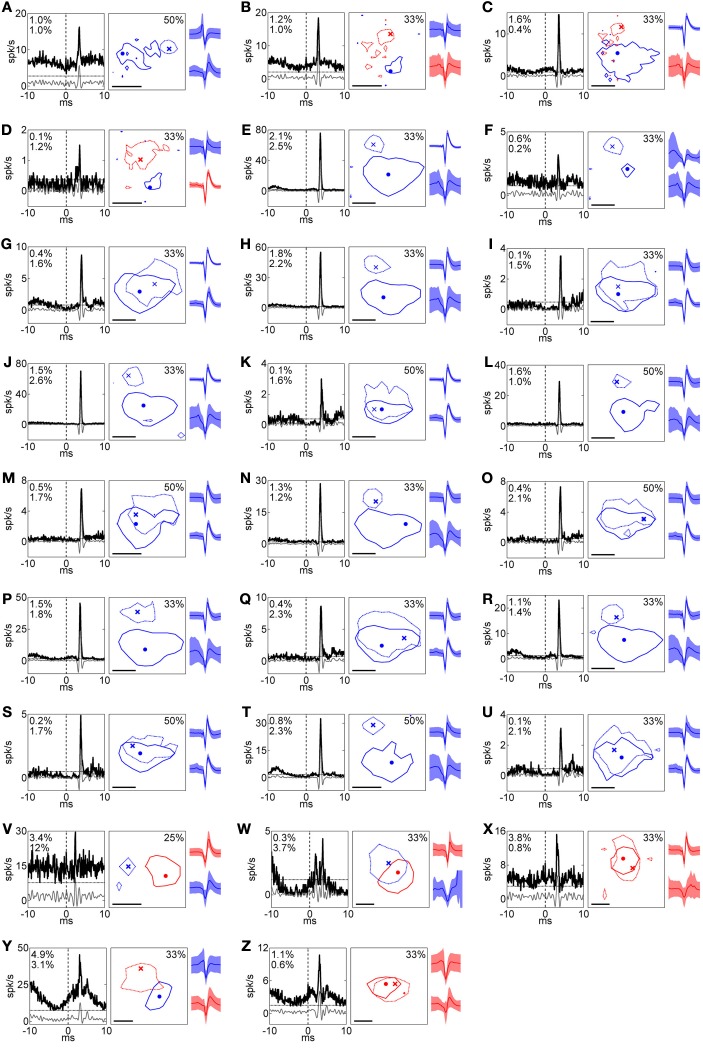
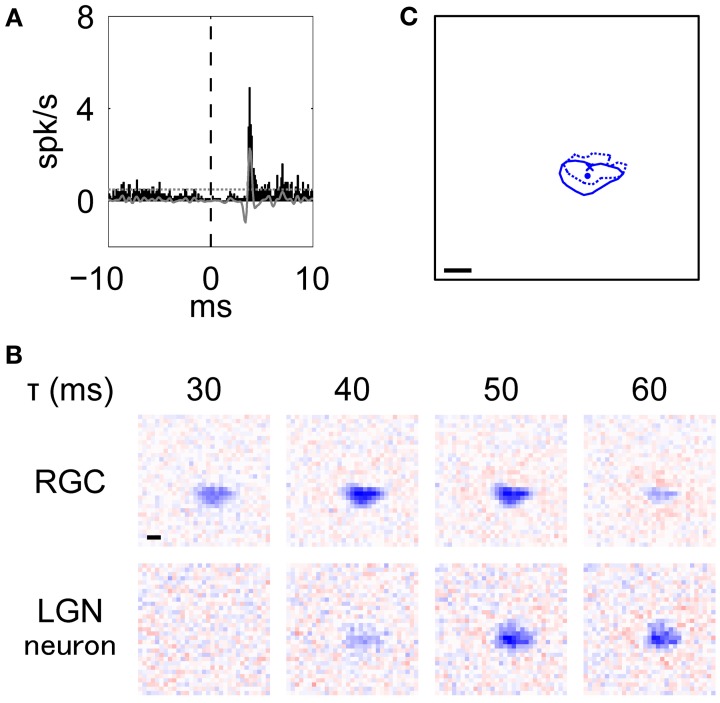
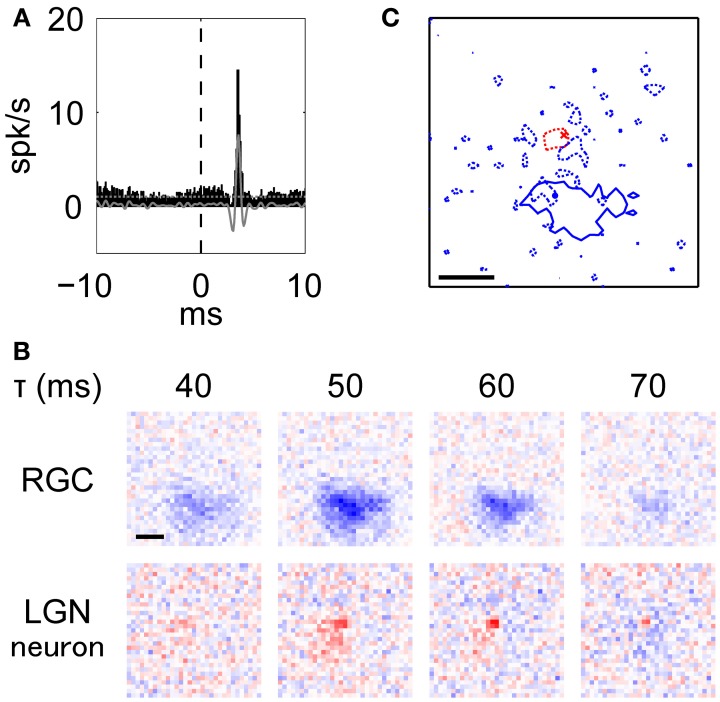
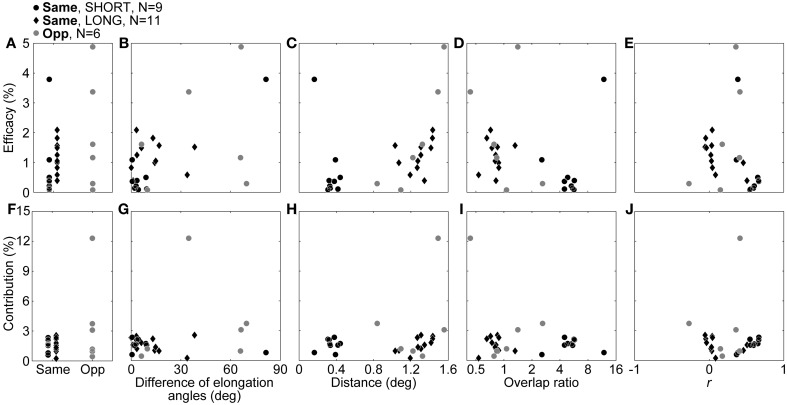
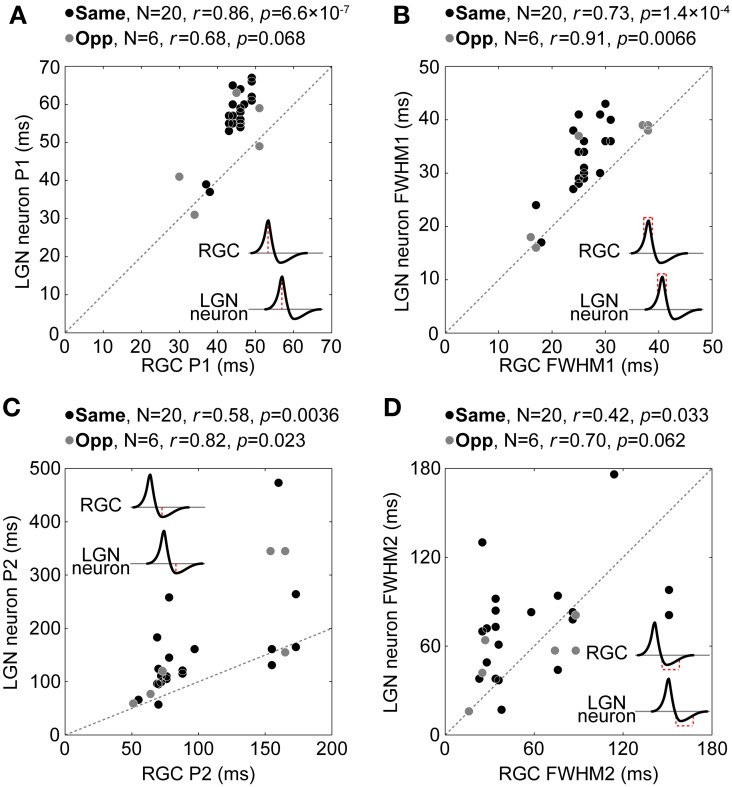
The spatial structure of the receptive field (RF) of cat lateral geniculate nucleus (LGN) neurons is significantly elliptical, which may provide a basis for the orientation tuning of LGN neurons, especially at high spatial frequency stimuli. However, the input mechanisms generating this elliptical RF structure are poorly defined. We therefore compared the spatiotemporal RF structures of pairs of retinal ganglion cells (RGCs) and LGN neurons that form monosynaptic connections based on the cross-correlation analysis of their firing activities. We found that the spatial RF structure of both RGCs and LGN neurons were comparably elliptical and oriented in a direction toward the area centralis. Additionally, the spatial RF structures of pairs with the same response sign were often overlapped and similarly oriented. We also found there was a small population of pairs with RF structures that had the opposite response sign and were spatially displaced and independently oriented. Finally, the temporal RF structure of an RGC was tightly correlated with that of its target LGN neuron, though the response duration of the LGN neuron was significantly longer. Our results suggest that the elliptical RF structure of an LGN neuron is mainly inherited from the primary projecting RGC and is affected by convergent inputs from multiple RGCs. We discuss how the convergent inputs may enhance the stimulus feature sensitivity of LGN neurons.

Keywords: cat; cross-correlation; lateral geniculate nucleus neuron; receptive field; retinal ganglion cell.


Figures

Figure 1
Figure 1
Comparison of RF structures of RGCs and LGN neurons. (A) Example of a RF structure of an ON-center RGC at the peak response latency (40 ms). Reddish and bluish colors indicate ON- and OFF-responses, respectively. The aspect ratio, elongation angle (solid arc) of the center region, and eccentric angle (dotted arc) were 1.38, 142, and 123°, respectively. AC indicates the area centralis. Scale bar = 1°. (B–D) Distributions of the aspect ratios (B), relationship between the elongation and eccentric angles (see details in text) (C), and distributions of differences between elongation and eccentric angles (D). Black and gray bars/circles indicate RGCs and LGN neurons, respectively.
Figure 2
Figure 2
Summary of RFs and corresponding XCs for all pairs. (A)–(Z) Left, middle, and right columns indicate XC, RF, and spike shape, respectively. In the XC columns, black solid, gray solid, and horizontal dotted lines indicate raw XC, filtered XC, and threshold (mean + 5 SD), respectively, and numbers read efficacy (upper) and contribution (lower). In RF columns, solid and dotted lines indicate the RFs of the RGC and the LGN neuron, respectively. Numbers read the response levels of the contour lines for the both of units. Dot and cross symbols indicate the maximum response positions of the RGC and the LGN neuron, respectively. Scale bar = 1°. In spike shape columns, solid lines and shaded areas indicate mean and 1 SD, respectively. Colors correspond to the response sign (red, ON; blue, OFF). Upper and lower shapes are for an RGC and LGN neuron, respectively. Pairs in Figures 3, 4 correspond to (S) and (C), respectively. (B) and (C) are reconstructed from the same recording and exhibited the same LGN neuron with different RGCs, indicating two OFF-center RGCs were projecting to one ON-center LGN neuron.
Figure 3
Figure 3
Typical example of an RGC-LGN neuron pair with RFs of the same response sign. This was the pair shown in Figure 2S. (A) XC of the pair. Black bars and gray line indicate raw and filtered data, respectively. Horizontal dotted line indicates mean + 5 SD. (B) Spatiotemporal RF structures (top: RGC, bottom: LGN neuron; left to right: shorter to longer latencies). (C) Overlaid image of the RF centers. Solid line and dot indicate 50% of response level and center position of the RGC, respectively. Dotted line and cross-symbol indicate those of the LGN neuron. The RF center positions were obtained from the fitted parameters. In (B) and (C), scale bar = 1°.
Figure 4
Figure 4
Typical example of an RGN-LGN neuron pair with RFs of the opposite response sign. This was the pair shown in Figure 2C. (A)–(C) Details are the same as Figure 3. Note that the blue dotted lines in (C) indicate the RF surround of the LGN neuron at 25% response level at latency 70 ms.
Figure 5
Figure 5
Relationship between the spatial RF structures of retinogeniculate-connected pairs (N = 26). (A) Distributions of the difference of elongation angles of the spatial RF structures. (B) Distributions of RF center distances of the pairs. (C) Distributions of the overlap ratios between the antagonistic RF center regions of the pairs. (D) Distributions of r between the spatial RF structures of the pairs. An RGC-LGN neuron pair exhibit completely overlapped RF structures with the same response sign when r = 1 and completely overlapped RF structures with the opposite response sign when r = −1. In (A–D), insets indicate schematic spatial RF structures. θ, D, S indicate the difference of elongation angles, distance between RF center positions, and size of spatial RF structure, respectively. Black and gray bars/circles indicate pairs with RFs of the same (N = 20) and opposite response sign (N = 6), respectively. (E) Schematic summary of spatial RF structures in the retinogeniculate connections. Solid and dotted lines indicate spatial RF structures of RGCs and the corresponding target LGN neurons, respectively. In same- and opposite-response-sign pairs, RGCs exhibit ON-center and OFF-center RFs, respectively. In both pairs, LGN neuron exhibits ON-center OFF-surround RF.
Figure 6
Figure 6
Efficacy and contribution, and the correlations with RF properties. In the upper row, the efficacy itself (A), correlations with the difference of the elongation angles (B), distance between RF center positions (C), overlap ratio (D), and correlation coefficient of the RF structures (E), are shown. In the lower row, the contribution itself (F), correlations with differences of elongation angles (G), distance between RF center positions (H), overlap ratio (I), and correlation coefficient of the RF structures (J) are shown. Black dots, black diamonds, and gray dots indicate SHORT, LONG, and opposite-response-sign connections, respectively.
Figure 7
Figure 7
Relationships between cell types and RF properties. From left to right, the relationships between the cell types in connection (XX, XY, and YX) and efficacy, contribution, difference of elongation angles, inter-RF-centers distance, overlap ratio, and correlation coefficient of RF structures are shown. Note that the range of some abscissae is different to those in Figures 5, 6 for ease of viewing.
Figure 8
Figure 8
Typical example of the temporal RF structure of LGN neurons. Horizontal and vertical axes indicate latency and normalized intensity of the temporal RF structure, respectively. P1, P2, FWHM1, FWHM2, and m indicate peak latency of the first response, peak latency of the rebound response, duration of the first response, duration of the rebound response, and relative amplitude of the rebound response, respectively. Insets indicate spatial RF structures at latencies of 0, 55 (P1), 96 (P2), 250 ms, respectively.
Figure 9
Figure 9
Relationship between temporal RF structures of retinogeniculate-connected pairs. Relationship between P1 (A), FWHM1 (B), P2 (C), and FWHM2 (D) for RGCs (horizontal axis) and LGN neurons (vertical axis). Black and gray circles indicate same- and opposite-response-sign pairs, respectively. Insets indicate schematic temporal RF structures. Note that the scale of the horizontal axis and that of the vertical axis are not equal in (C).

Similar articles

Cited by

References

    1. Ahmed B., Hammond P. (1991). Orientation bias of cat dorsal lateral geniculate cells: directional analysis of the major axis of the receptive field centre. Exp. Brain Res. 84, 676–679 10.1007/BF00230982 - DOI - PubMed
    1. Alonso J.-M., Yeh C.-I., Weng C., Stoelzel C. (2006). Retinogeniculate connections: a balancing act between connection specificity and receptive field diversity. Prog. Brain Res. 154, 3–13 10.1016/S0079-6123(06)54001-4 - DOI - PMC - PubMed
    1. Bonin V., Mante V., Carandini M. (2005). The suppressive field of neurons in lateral geniculate nucleus. J. Neurosci. 25, 10844–10856 10.1523/JNEUROSCI.3562-05.2005 - DOI - PMC - PubMed
    1. Bosking W. H., Zhang Y., Schofield B., Fitzpatrick D. (1997). Orientation selectivity and the arrangement of horizontal connections in tree shrew striate cortex. J. Neurosci. 17, 2112–2127 - PMC - PubMed
    1. Boycott B., Wässle H. (1974). The morphological types of ganglion cells of the domestic cat's retina. J. Physiol. 240, 397–419 - PMC - PubMed

LinkOut - more resources