. 2013 Dec 9:7:193.
doi: 10.3389/fnbeh.2013.00193. eCollection 2013.

Mouse Grueneberg ganglion neurons share molecular and functional features with C. elegans amphid neurons

Affiliations

Mouse Grueneberg ganglion neurons share molecular and functional features with C. elegans amphid neurons

Julien Brechbühl et al. Front Behav Neurosci. .

Abstract

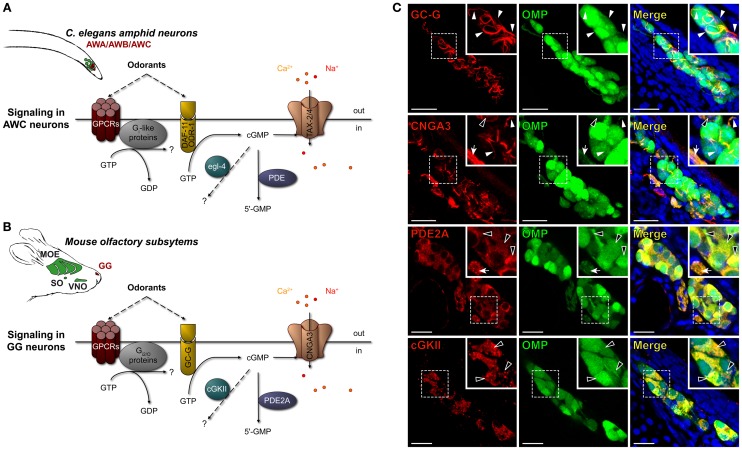
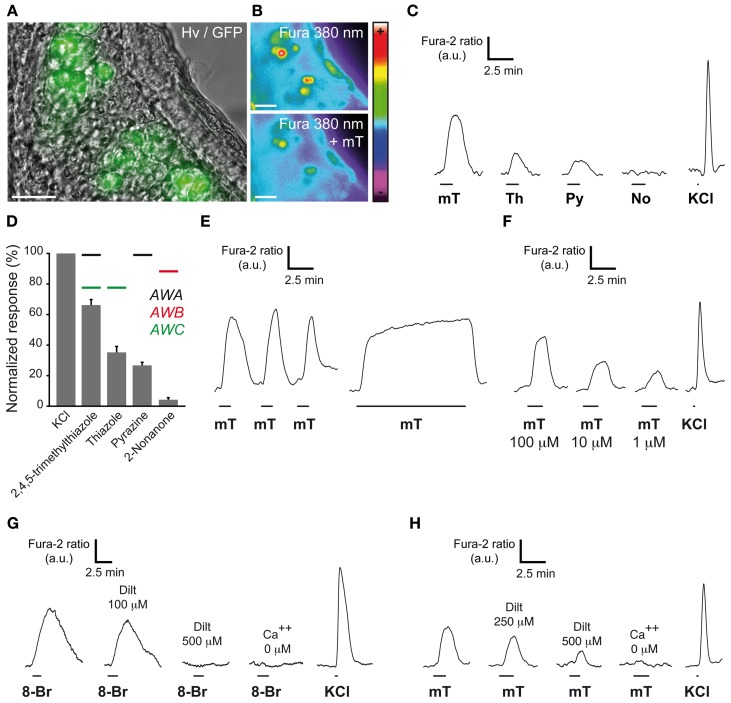
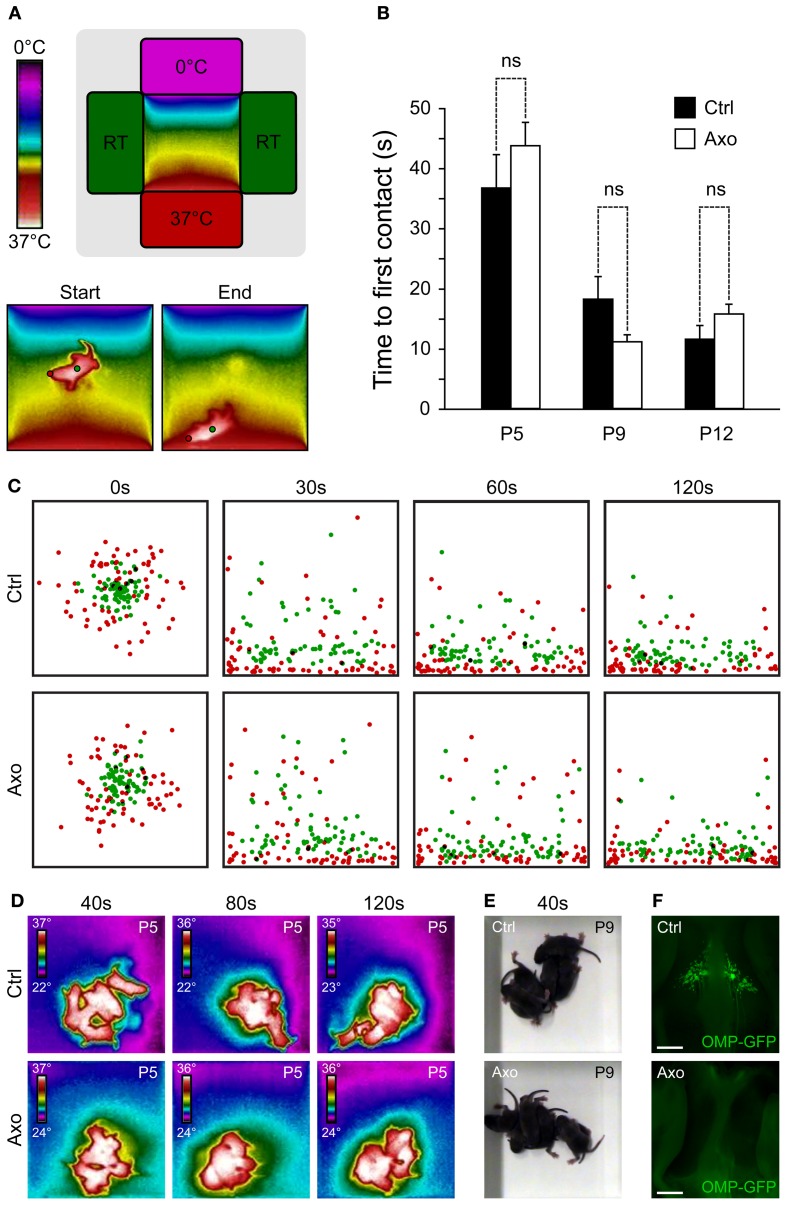
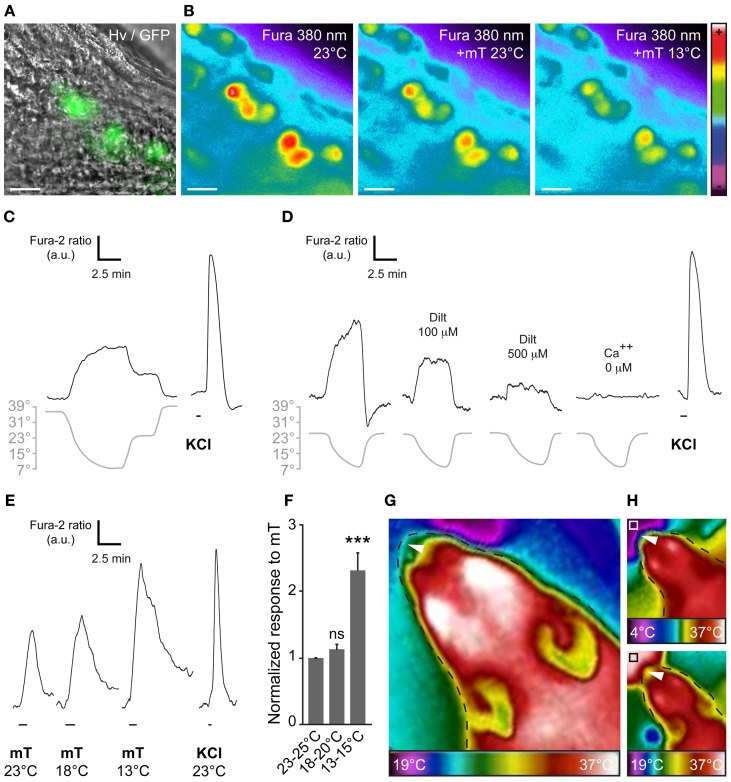
The mouse Grueneberg ganglion (GG) is an olfactory subsystem located at the tip of the nose close to the entry of the naris. It comprises neurons that are both sensitive to cold temperature and play an important role in the detection of alarm pheromones (APs). This chemical modality may be essential for species survival. Interestingly, GG neurons display an atypical mammalian olfactory morphology with neurons bearing deeply invaginated cilia mostly covered by ensheathing glial cells. We had previously noticed their morphological resemblance with the chemosensory amphid neurons found in the anterior region of the head of Caenorhabditis elegans (C. elegans). We demonstrate here further molecular and functional similarities. Thus, we found an orthologous expression of molecular signaling elements that was furthermore restricted to similar specific subcellular localizations. Calcium imaging also revealed a ligand selectivity for the methylated thiazole odorants that amphid neurons are known to detect. Cellular responses from GG neurons evoked by chemical or temperature stimuli were also partially cGMP-dependent. In addition, we found that, although behaviors depending on temperature sensing in the mouse, such as huddling and thermotaxis did not implicate the GG, the thermosensitivity modulated the chemosensitivity at the level of single GG neurons. Thus, the striking similarities with the chemosensory amphid neurons of C. elegans conferred to the mouse GG neurons unique multimodal sensory properties.

Keywords: Grueneberg ganglion; alarm pheromone; amphid neurons; behavior; calcium imaging; olfactory; temperature sensing.


Figures

Figure 1
Figure 1
Mouse GG neurons express in conserved subcellular localizations a set of signaling proteins related to those present in C. elegans chemosensory amphid neurons. (A,B) Schematic comparison of the main signaling proteins expressed in C. elegans amphid AWC neurons (A) and in the mouse GC-G positive GG neurons (B). C. elegans amphid neurons are indicated (in green), in particular the AWA, AWB, and AWC neurons (in red). The mouse olfactory subsystems (in green) are indicated as follows: GG, Grueneberg ganglion (in red); VNO, vomeronasal organ; SO, septal organ; MOE, main olfactory epithelium. The signaling elements are indicated as follows: cGMP, cyclic guanosine monophosphate; cGKII, cGMP-dependent protein kinase of type 2; CNGA3, cyclic nucleotide-gated channels 3; DAF-11/ODR-1, potential receptor-like transmembranous guanylyl cyclase; egl-4, cGMP-dependent protein kinase; GC-G, particulate guanylyl cyclase G; GPCRs, G protein coupled receptors; PDE, phosphodiesterase; PDE2A, phosphodiesterase 2A; TAX-2/4, cyclic nucleotide-gated (CNG)-like channels. (C) Immunohistochemistry experiments on coronal slices of the GG of OMP-GFP mice for homologous signaling proteins found in C. elegans amphid neurons. GC-G was found to be expressed in the cilia. CNGA3 was found to be expressed principally in cilia and axons; some somatic expression could also be observed. PDE2A was found in soma and in axons. cGKII was found in soma. The specific subcellular localizations are shown in high power views (white dashed rectangles). White arrowheads indicate ciliary processes, black arrowheads indicate soma and white arrows indicate axons. A minimum of 2 animals (from P0–P29) and 6 slices were used for each antibody staining tested. Nuclei are shown in blue (DAPI counterstain). Scale bars, 20 μm.
Figure 2
Figure 2
GG neurons respond to ligands of amphid neurons. (A) GG coronal slice from an OMP-GFP mouse where GG neurons can be observed with their intrinsic GFP fluorescence and Hoffman modulation view (Hv). (B) Fluorescence of Fura-2AM into GG cells observed at 380 nm in color encoded map for unbound Fura before and at the peak of an intracellular calcium increase induced by 2,4,5-trimethylthiazole (mT). (C–H) Chemostimulations of GG neurons realized at RT. (C) Representative calcium transients induced in the same GG neuron by the successive perfusion of amphid AWA, AWB, and AWC ligands (100 μ M). (D) Histogram summarizing Fura-2 ratio peak Ca2+ responses to stimulation with the different activators (100 μ M) normalized to KCl responses (20 mM). Perfusion of mT (n number of responding neurons/number of total neurons = 66/66), thiazole (Th; n = 14/16), pyrazine (Py; n = 32/34) but not 2-nonanone (No; n = 0/18) increased the intracellular calcium concentration. Color bars indicate the AWA (in black), AWB (in red) or AWC (in green) ligand's relationship. 2–9 mice (P1–P26) were used for each tested chemical. Values are expressed as mean ± s.e.m. (E) mT responses were rapidly reversible and reproducible (n number of tested neurons = 16). No adaptation was observed in the presence of mT for a period of 10 min (n = 15). (F) The calcium increases generated by 2,4,5-trimethylthiazole (mT) were observed over a broad concentration range (from 100–1 μ M; n = 10). (G) Representative calcium transients induced in GG neurons by perfusion of a cGMP membrane-permeable analog, the 8-bromoguanosine 3′, 5′-cyclic monophosphate (8-Br; 500 μ M), and inhibited by increasing concentrations of the cyclic nucleotide-gated channel blocker L-cis diltiazem (Dilt, n = 11). A 8-Br response was not observed in calcium-free medium (n = 48). (H) mT responses could be partially inhibited by L-cis diltiazem [Dilt 250 μ M (26%, n = 11); 500 μ M (58%, n = 6)]. Fluorescence intensity Fura-2 ratio = F340/F380 is indicated by arbitrary units (a.u.). Perfusion times are indicated by horizontal bars. Traces illustrated in (C), (E), (F), (G), and (H) are representative responses observed in single GG neurons for each panel. Scale bars, 20 μm in (A) and (B).
Figure 3
Figure 3
A functional GG is not necessary for thermotaxis and huddling behaviors. (A–C) Thermotaxis analysis. (A) Schematic representation of the arena visualized with a thermal camera. The pup is placed in the middle of the arena and, during a session of 3 min, localization is recorded. Red dot represents the GG localization and, the green dot, the body center. (B) The time necessary for the tip of the nose (red dot) to be in contact with the 37°C wall is measured, for P5, P9, and P12. Experiments were done with sham control (Ctrl; n = 7) pups and GG axotomized (Axo; n = 18) pups; each pup has been used in 4 sessions. (C) Merge view of the localization of the tip of the nose (red dots) and body center (green dots) after 0, 30, 60, and 120 s for P5, P9, and P12. For clarity, only the 4 sessions of 6 different pups (at the three tested ages) per phenotype were plotted (C). (D–F) Huddling analysis. (D) Thermal view of 6 pups per phenotype at P5, after 40, 80, and 120 s. (E) Normal view at P9 after 40 s. (F) Phenotyping was done at the end of the thermotaxis and huddling behavioral sessions, at P15. The Ctrl (presence of GG) and Axo (no GG) mice were grouped for post-analysis. Scale bars, 500 μm in (F). Values are expressed as mean ± s.e.m.; w-test, *P < 0.05; **P < 0.01; ***P < 0.001; ns, not significant.
Figure 4
Figure 4
The chemosensitivity of GG neurons is modulated by temperature variations. (A) GG coronal slice from an OMP-GFP mouse, GG neurons can be observed with their intrinsic GFP fluorescence and Hoffman modulation view (Hv). (B) Representative Fura-2AM loaded slice observed at 380 nm in color encoded map for unbound Fura during different combination of temperature and mT perfusion. (C–D) Fine adjustment of the calcium level in the majority of GG neurons by temperature variations (n number of responding neurons/number of total neurons = 36/48; 7 mice from P1–P19). Gray lines indicate bath temperature variations. (C) In perfusions of 10 min, a linear intracellular adaptation of the calcium level in a single GG neuron is observed during variations in bath temperature (n number of tested neurons = 23). (D) cGMP dependence of coolness-evoked GG responses. Calcium transients could be partially inhibited by L-cis diltiazem [Dilt 100 μ M (32%, n = 5); 500 μ M (69%, n = 16)] and totally in calcium-free medium (n = 16). (E) Representative calcium transients induced in GG neurons by perfusion of mT (100 μ M) at different temperatures. Perfusions of KCl (20 mM) were used as viability control. (F) Normalized increased response to mT in function of the temperature (n = 25; 3 mice from P4–P23). (G,H) The apparent temperature of the tip of the mouse nose (GG region; white arrowheads) is dependent on the ambient temperature. Thermal view of a female mouse head (P21). (G) The GG region is close to the ambient temperature (25 ± 3°C). (H) The same mouse is observed while sniffing a cold (upper panel, white square, 4°C) or a hot (lower panel, black square, 37°C) tube. The observed temperatures of the tip of the nose are 18 ± 2°C and 29 ± 3°C, respectively. Thermal gradient scales are indicated under the mouse head pictures. Fluorescence intensity Fura-2 ratio = F340/F380 is indicated by arbitrary units (a.u.). Perfusion times are indicated by horizontal bars. Traces illustrated in (C), (D), and (E) are representative responses observed in single GG neurons for each panel. Scale bars, 20 μm in (A) and (B). Values are expressed as mean ± s.e.m.;t-test, *P < 0.05; **P < 0.01; ***P < 0.001; ns, not significant.

Similar articles

Cited by

References

    1. Ache B. W., Young J. M. (2005). Olfaction: diverse species, conserved principles. Neuron 48, 417–430 10.1016/j.neuron.2005.10.022 - DOI - PubMed
    1. Adachi R., Wakabayashi T., Oda N., Shingai R. (2008). Modulation of Caenorhabditis elegans chemotaxis by cultivation and assay temperatures. Neurosci. Res. 60, 300–306 10.1016/j.neures.2007.11.010 - DOI - PubMed
    1. Alberts J. R. (1978). Huddling by rat pups: multisensory control of contact behavior. J. Comp. Physiol. Psychol. 92, 220–230 10.1037/h0077458 - DOI - PubMed
    1. Alberts J. R. (2007). Huddling by rat pups: ontogeny of individual and group behavior. Dev. Psychobiol. 49, 22–32 10.1002/dev.20190 - DOI - PubMed
    1. Alcedo J., Kenyon C. (2004). Regulation of C. elegans longevity by specific gustatory and olfactory neurons. Neuron 41, 45–55 10.1016/S0896-6273(03)00816-X - DOI - PubMed