. 2013 Dec 6:5:88.
doi: 10.3389/fnagi.2013.00088. eCollection 2013.

High ferritin levels have major effects on the morphology of erythrocytes in Alzheimer's disease

Affiliations

High ferritin levels have major effects on the morphology of erythrocytes in Alzheimer's disease

Janette Bester et al. Front Aging Neurosci. .

Abstract

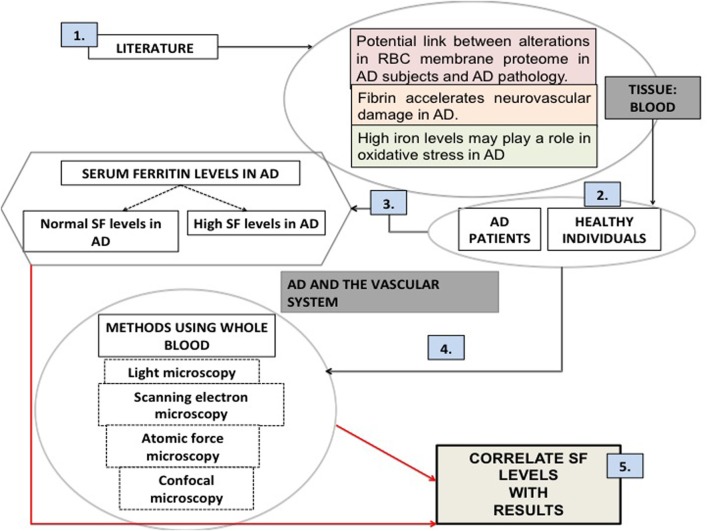
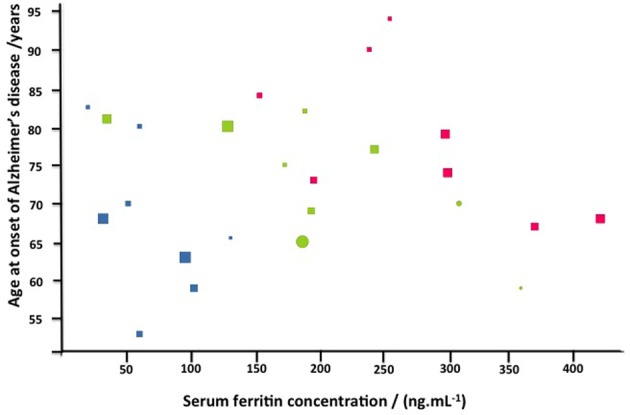
Introduction: Unliganded iron both contributes to the pathology of Alzheimer's disease (AD) and also changes the morphology of erythrocytes (RBCs). We tested the hypothesis that these two facts might be linked, i.e., that the RBCs of AD individuals have a variant morphology, that might have diagnostic or prognostic value.

Methods: We included a literature survey of AD and its relationships to the vascular system, followed by a laboratory study. Four different microscopy techniques were used and results statistically compared to analyze trends between high and normal serum ferritin (SF) AD individuals.

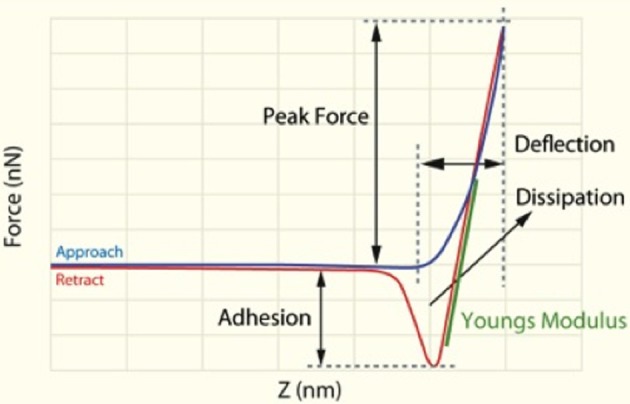
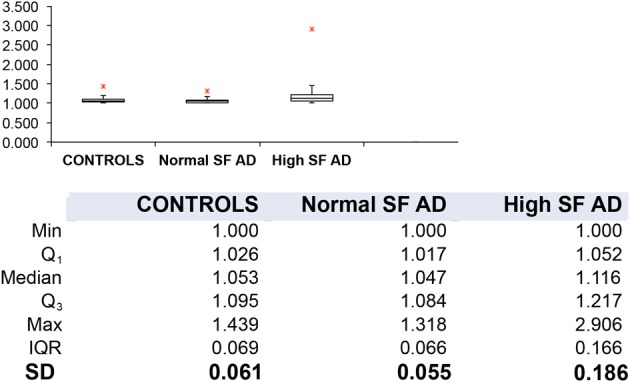
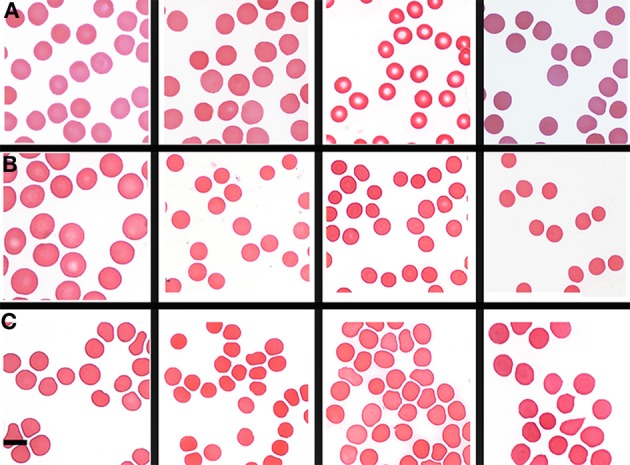
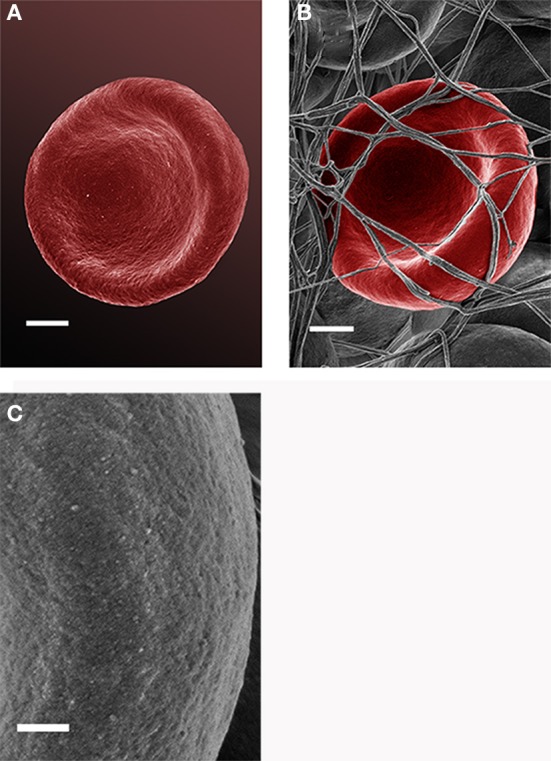
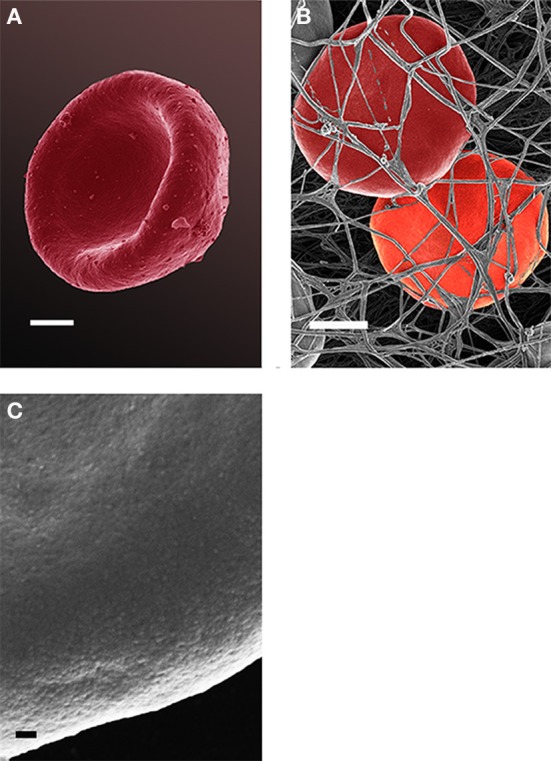
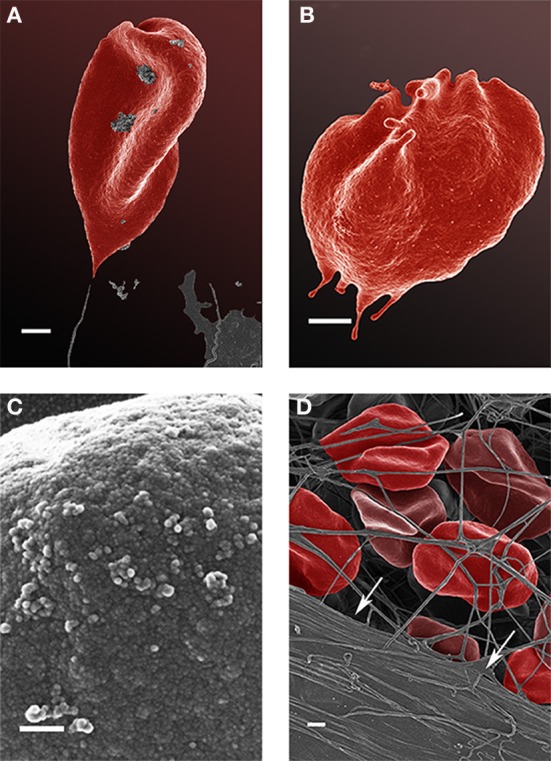
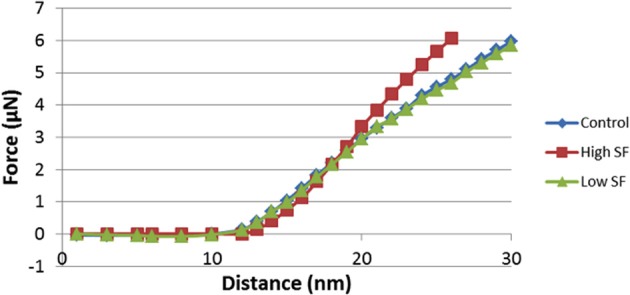
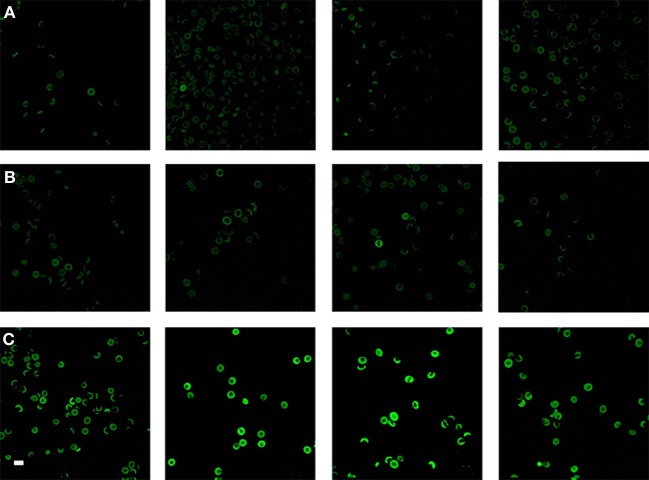
Results: Light and scanning electron microscopies showed little difference between the morphologies of RBCs taken from healthy individuals and from normal SF AD individuals. By contrast, there were substantial changes in the morphology of RBCs taken from high SF AD individuals. These differences were also observed using confocal microscopy and as a significantly greater membrane stiffness (measured using force-distance curves).

Conclusion: We argue that high ferritin levels may contribute to an accelerated pathology in AD. Our findings reinforce the importance of (unliganded) iron in AD, and suggest the possibility both of an early diagnosis and some means of treating or slowing down the progress of this disease.

Keywords: Alzheimer's disease; atomic force microscopy; erythrocytes; iron; scanning electron microscopy.


Figures

Figure 1
Figure 1
An overview figure summarizing the contents of this manuscript. (1) Literature suggests that there is a rationale for looking at the vascular system and particularly blood; (2) our sample was chosen to be a random group of Alzheimer's individuals (AD), as well as healthy individuals; (3) (unliganded) iron has been implicated in the literature as a role player in AD; serum ferritin levels were measured; (4) our methodologies included various microscopy techniques; (5) finally we correlated our microscopy results to the presence of high serum ferritin levels.
Figure 2
Figure 2
Schematic representation of force/separation plot illustrating the type of the information that can be obtained [adapted and redrawn from Berquand (2011)].
Figure 3
Figure 3
Box plots and descriptive statistics of the axial ratios of erythrocytes of healthy individuals and of Alzheimer's patients (AD) with normal or high serum ferritin (SF) levels. There were no significant difference between the axial ratios of RBCs of healthy individuals and those of normal SF AD patients (p = 0.099), however, there were significant differences between the axial ratios of erythrocytes from normal SF AD patients vs. those of high SF AD patients (p = 1.07·10−11) and between those of healthy individuals and those from high SF AD patients (p = 1.84·10−35).
Figure 4
Figure 4
Light microscopy smears of (A) four healthy individuals and (B) four normal and (C) four high normal serum ferritin (SF) Alzheimer's (AD) individuals. Scale = 5 μm.
Figure 5
Figure 5
Scanning electron microscopy (SEM) micrographs of a typical healthy red blood cell (scale = 1 μm) (A). RBC that is discoid in shape when thrombin is added to whole blood (scale = 1 μm) (B); high magnification of RBC membrane, showing globular structure; (C) (Scale = 100 nm).
Figure 6
Figure 6
Red blood cell from a normal SF AD individual (scale = 1 μm) (A); where thrombin is added to whole blood; the cells keep their discoid shape (scale = 1 μm) (B); high magnification of RBC membrane, showing globular structure (Scale = 100 nm) (C).
Figure 7
Figure 7
Scanning electron microscopy (SEM) micrographs of a typical high serum ferritin (SF) Alzheimer's (AD) individual (scale = 1 μm) (A,B). High machine magnification (150,000×) of a typical RBC membrane from a high serum ferritin (SF) Alzheimer's (AD) individual (Scale = 100 nm) (C); red blood cell from a high serum ferritin (SF) Alzheimer's (AD) individual where thrombin is added to whole blood; the cells loose their discoid shapes and dense matted fibrin deposits are present in the lower left corner of the micrograph (indicated by arrows) (scale = 1 μm) (D).
Figure 8
Figure 8
Force-Distance curves obtained on RBCs from healthy individuals, normal serum ferritin (SF) Alzheimer's (AD) individuals and high serum ferritin (SF) Alzheimer's (AD) individuals. Force-Distance curves show the atomic force microscope (AFM) cantilever deflection range on the platelet surface.
Figure 9
Figure 9
Confocal microscopy of RBCs from (A) four healthy individuals, (B) four normal serum ferritin (SF) Alzheimer's individuals (AD) and (C) four high SF AD individuals. Scale = 10 μm.
Figure 10
Figure 10
Alzheimer's disease as a function of serum ferritin for normal (blue) slightly (green) or strongly affected (red) morphologies. Also displayed are gender (females circles, males squares), and duration in years (via the size of the symbols).

Similar articles

Cited by

References

    1. Adams P. (2008). Management of elevated serum ferritin levels. Gastroenterol. Hepatol. (N.Y.) 4, 333–334 - PMC - PubMed
    1. Adams P. C., Passmore L., Chakrabarti S., Reboussin D. M., Acton R. T., Barton J. C., et al. (2006). Liver diseases in the hemochromatosis and iron overload screening study. Clin. Gastroenterol. Hepatol. 4, 918–923; quiz 807. 10.1016/j.cgh.2006.04.013 - DOI - PubMed
    1. Adams P. C., Reboussin D. M., Barton J. C., McLaren C. E., Eckfeldt J. H., McLaren G. D., et al. (2005). Hemochromatosis and iron-overload screening in a racially diverse population. N. Engl. J. Med. 352, 1769–1778 10.1056/NEJMoa041534 - DOI - PubMed
    1. Aisen P., Enns C., Wessling-Resnick M. (2001). Chemistry and biology of eukaryotic iron metabolism. Int. J. Biochem. Cell Biol. 33, 940–959 10.1016/S1357-2725(01)00063-2 - DOI - PubMed
    1. Anderson L. J., Holden S., Davis B., Prescott E., Charrier C. C., Bunce N. H., et al. (2001). Cardiovascular T2-star (T2*) magnetic resonance for the early diagnosis of myocardial iron overload. Eur. Heart J. 22, 2171–2179 10.1053/euhj.2001.2822 - DOI - PubMed