. 2013 Dec 5:4:426.
doi: 10.3389/fimmu.2013.00426. eCollection 2013.

Asymmetry in erythroid-myeloid differentiation switch and the role of timing in a binary cell-fate decision

Affiliations

Asymmetry in erythroid-myeloid differentiation switch and the role of timing in a binary cell-fate decision

Afnan Alagha et al. Front Immunol. .

Abstract

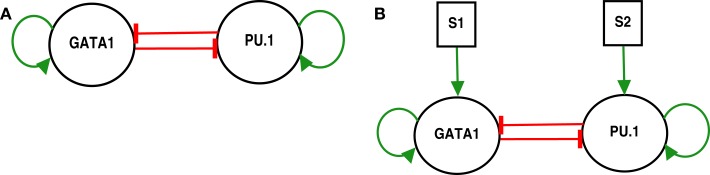
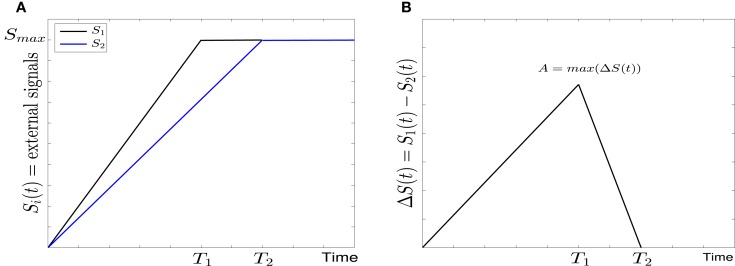
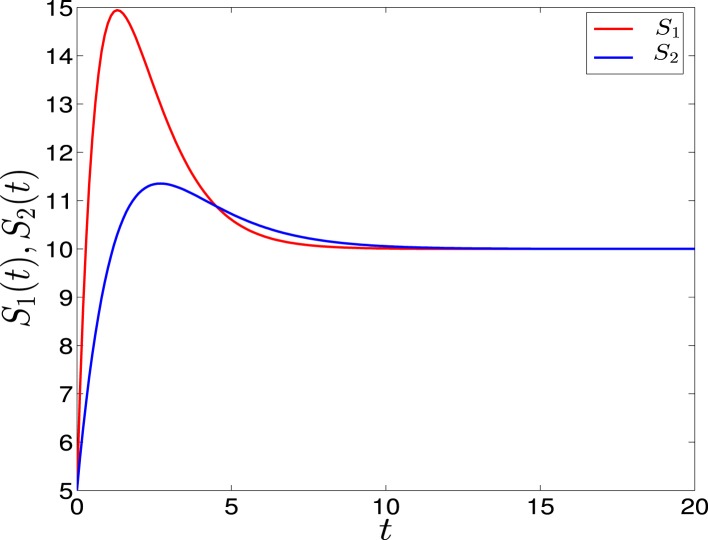
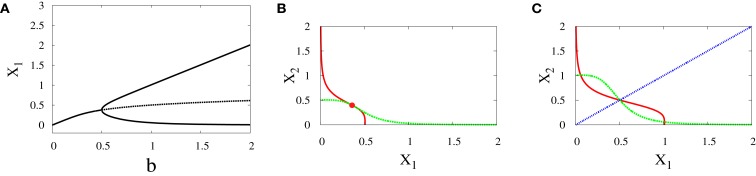
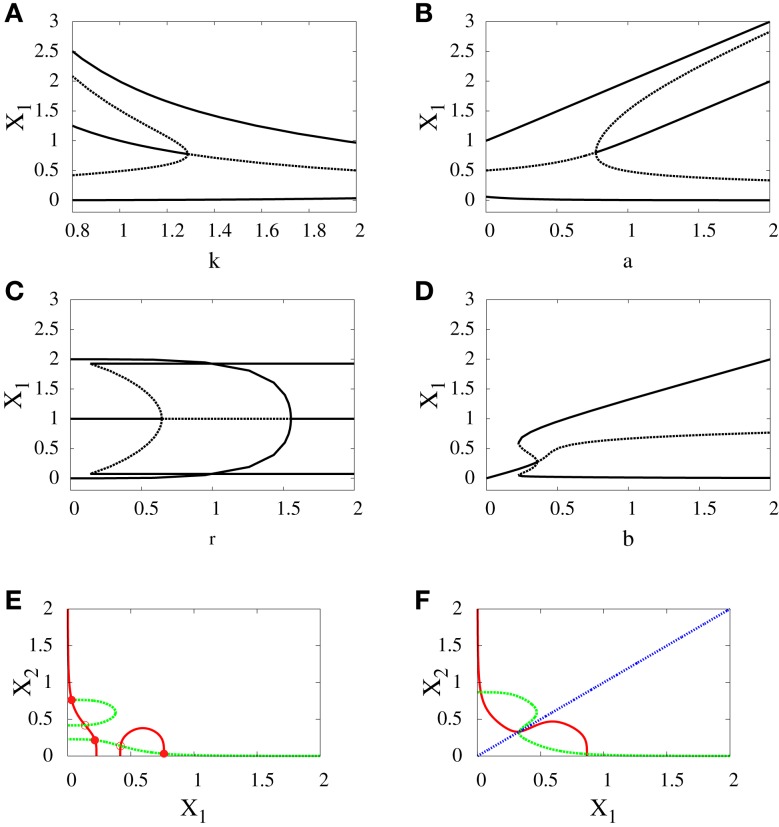
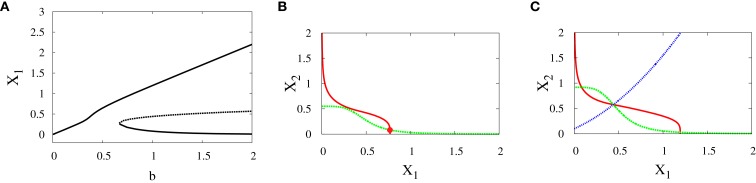
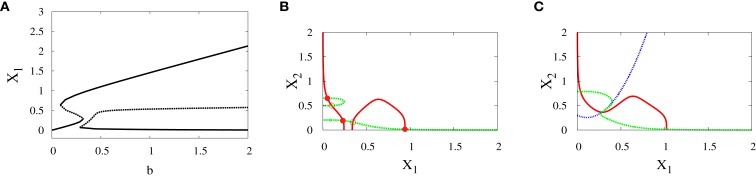
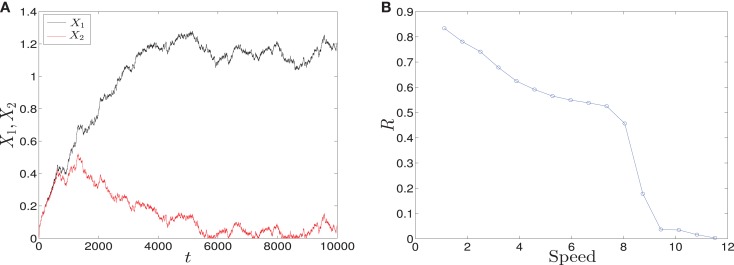
GATA1-PU.1 genetic switch is a paradigmatic genetic switch that governs the differentiation of progenitor cells into two different fates, erythroid and myeloid fates. In terms of dynamical model representation of these fates or lineages corresponds to stable attractor and choosing between the attractors. Small asymmetries and stochasticity intrinsically present in all genetic switches lead to the effect of delayed bifurcation which will change the differentiation result according to the timing of the process and affect the proportion of erythroid versus myeloid cells. We consider the differentiation bifurcation scenario in which there is a symmetry-breaking in the bifurcation diagrams as a result of asymmetry in external signaling. We show that the decision between two alternative cell fates in this structurally symmetric decision circuit can be biased depending on the speed at which the system is forced to go through the decision point. The parameter sweeping speed can also reduce the effect of asymmetry and produce symmetric choice between attractors, or convert the favorable attractor. This conversion may have important contributions to the immune system when the bias is in favor of the attractor which gives rise to non-immune cells.

Keywords: GATA1-PU.1 switch; differentiation; immune cells; pluripotent cells.


Figures

Figure 1
Figure 1
GATA1-PU.1 genetic switch with and without external signals. (A) The isolated switch consists of two transcription factors GATA1 and PU.1 that activate themselves while inhibit each other’s expression. (B) The exposure of the same switch in (A) to two external signals S1 and S2.
Figure 2
Figure 2
Linear form of external signals in GATA1-PU.1 genetic switch. (A) Two external signals S1 and S2 with different rising times but equal steady states at Smax = 10. (B) The difference between the external signals with maximal asymmetry at A.
Figure 3
Figure 3
Adaptation form of external signals in GATA1-PU.1 genetic switch. The external signals S1 and S2 have different rising times but equal steady states at v = 10. Note that at the end of the signaling the system is structurally symmetric.
Figure 4
Figure 4
Supercritical pitchfork bifurcation diagrams for symmetric scenario. Bifurcation diagram (A) and nullclines at the beginning (B) and end (C) of the bifurcation. For all diagrams, n = 4, r = 0.5, a1 = a2 = 0.01, k1 = k2 = 1. The solid lines indicate stability, while dashed lines indicate unstable branches.
Figure 5
Figure 5
Subcritical pitchfork bifurcation diagrams for symmetric scenario. Bifurcation diagrams (A–D) and nullclines at the beginning (E) and end (F) of the bifurcation diagram (D). For all n = 4. For (A) a = 1, b = 1, r = 0.5, (B) b = 1, k = 1, r = 0.5, (C) a = 1, b = 1, k = 1, (D–F) a1 = a2 = 1, k1 = k2 = 1.5. In (C) there is also supercritical pitchfork bifurcation.
Figure 6
Figure 6
Asymmetric scenario. Supercritical pitchfork bifurcation diagrams. Bifurcation diagram (A) and nullclines at the beginning (B) and end (C) of the bifurcation. The parameters are n = 4, r = 0.5, a1 = 0.2, a2 = 0.01, k1 = 1, k2 = 1.1.
Figure 7
Figure 7
Asymmetric scenario. Subcritical pitchfork bifurcation diagrams. Bifurcation diagram (A) and nullclines at the beginning (B) and end (C) of the bifurcation. The parameters are n = 4, r = 0.5, a1 = 1.2, a2 = 1, k1 = 1.5, k2 = 1.6.
Figure 8
Figure 8
Trajectories and parameter sweeping speed. (A) Time evolution of X1 and X2 in the asymmetric supercritical pitchfork bifurcation. (B) The effect of increasing the speed of crossing the critical region on the distribution of trajectories in the attractors for 10000 iterations. As the speed is increased, the ratio R changes from 1 to 0. Hence, increasing the speed causes a large switch from the favorable attractor to the other one. Parameters are a1 = 0.2, a2 = 0.01, k1 = 1, k2 = 1.1, n = 4, r = 0.5. Also, in (A) σ2 = 0.01, (B) σ2 = 0.5.
Figure 9
Figure 9
Two-parameter bifurcation diagram. The bifurcation in the parameter space (S1, S2), where S1 and S2 are external signals in the genetic switch. The borders separate between the regions of monostability I and the region of bistability II. Parameters are a1 = a2 = 0.05, b1 = b2 = 0.45, r = 0.5,k1 = k2 = 1.
Figure 10
Figure 10
Nullclines and bifurcation diagrams with symmetric and asymmetric external signals. For all figures, a1 = a2 = 0.05, b1 = b2 = 0.45, r = 0.5, k1 = k2 = 1, n = 4. (A) Nullclines for S1 = S2 = 1 show one stable steady state, (B) nullclines for S1 = S2 = 4 show bistability, (C) near-symmetric supercritical pitchfork bifurcation, (D) nullclines for S1 = 3, S2 = 1 show one stable steady state shifted to the right, (E) nullclines for S1 = 6, S2 = 4 show bistability with larger basin of attraction to the right of the separatrix (almost diagonal line), (F) imperfect supercritical pitchfork bifurcation due to the asymmetry between the external signals.
Figure 11
Figure 11
Trajectories and effect of the external signaling speed. In (A,C) the time evolution of X1 and X2 under the effect of linear and adaptation form of signals is shown, respectively. The values of X1 increase and the values of X2 decrease because S1 is chosen to be faster than S2. Hence, trajectories choose the attractor which has a larger value of X1. (B) The effect of increasing the speed of linear form of signals for 1000 iterations. As the speed is increased, the ratio R tends to 0.5. Thus, increasing the speed increases the symmetry in the switch. (D) The effect of speed with the adaptation form of signals. Decreasing the speed gives ratio R tending to 0.5. Surprisingly, now decreasing the speed increases the symmetry in the switch. Parameters in (A), (B) are A = 2.5, Smax = 10, (C,D) h1 = h2 = 10, v = 10, and for all we have a1 = a2 = 0.05, b1 = b2 = 0.45, r = 0.5, k1 = k2 = 1.

Similar articles

Cited by

References

    1. Laslo P, Pongubala JMR, Lancki DW, Singh H. Gene regulatory networks directing myeloid and lymphoid cell fates within the immune system. Semin Immunol (2008) 20:228–3510.1016/j.smim.2008.08.003 - DOI - PubMed
    1. Huang S, Guo Y, May G, Enver T. Bifurcation dynamics in lineage-commitment in bipotent progenitor cells. Dev Biol (2007) 305:695–71310.1016/j.ydbio.2007.02.036 - DOI - PubMed
    1. Chickarmane V, Enver T, Peterson C. Computational modeling of the hematopoietic erythroid-myeloid switch reveals insight into cooperativity, priming, and irreversibility. PLoS Comput Biol (2009) 5(1):e1000268.10.1371/journal.pcbi.1000268 - DOI - PMC - PubMed
    1. Palani S, Sarkar CA. Positive receptor feedback during lineage commitment can generate ultrasensitivity to ligand and confer robustness to a bistable switch. Biophys J (2008) 95:1575–8910.1529/biophysj.107.120600 - DOI - PMC - PubMed
    1. Palani S, Sarkar CA. Integrating extrinsic and intrinsic cues into a minimal model of lineage commitment for hematopoietic progenitors. PLoS Comput Biol (2009) 5(9):e1000518.10.1371/journal.pcbi.1000518 - DOI - PMC - PubMed

LinkOut - more resources