. 2013 Dec 6:4:427.
doi: 10.3389/fimmu.2013.00427. eCollection 2013.

Pre-clustering of the B cell antigen receptor demonstrated by mathematically extended electron microscopy

Affiliations

Pre-clustering of the B cell antigen receptor demonstrated by mathematically extended electron microscopy

Gina J Fiala et al. Front Immunol. .

Abstract

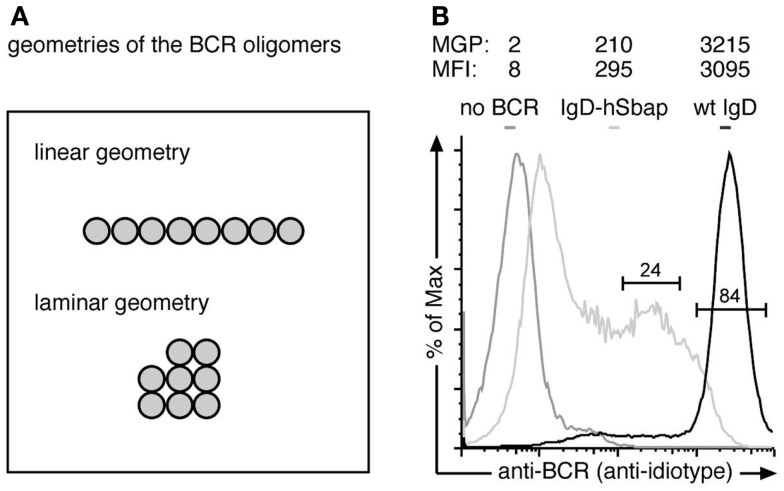
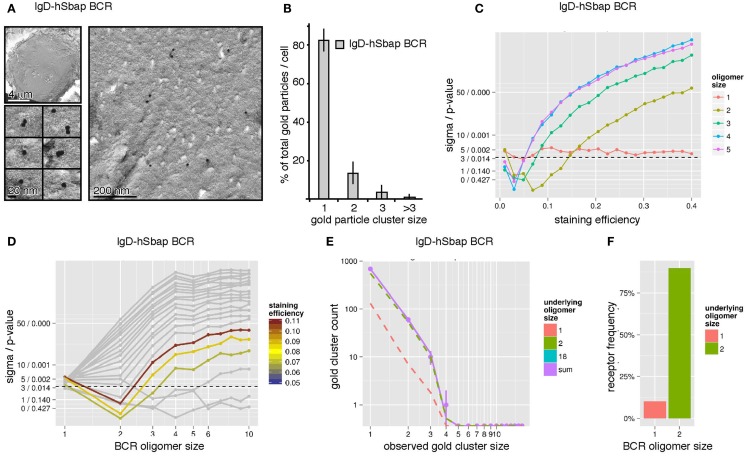
The B cell antigen receptor (BCR) plays a crucial role in adaptive immunity, since antigen-induced signaling by the BCR leads to the activation of the B cell and production of antibodies during an immune response. However, the spatial nano-scale organization of the BCR on the cell surface prior to antigen encounter is still controversial. Here, we fixed murine B cells, stained the BCRs on the cell surface with immuno-gold and visualized the distribution of the gold particles by transmission electron microscopy. Approximately 30% of the gold particles were clustered. However the low staining efficiency of 15% precluded a quantitative conclusion concerning the oligomerization state of the BCRs. To overcome this limitation, we used Monte-Carlo simulations to include or to exclude possible distributions of the BCRs. Our combined experimental-modeling approach assuming the lowest number of different BCR sizes to explain the observed gold distribution suggests that 40% of the surface IgD-BCR was present in dimers and 60% formed large laminar clusters of about 18 receptors. In contrast, a transmembrane mutant of the mIgD molecule only formed IgD-BCR dimers. Our approach complements high resolution fluorescence imaging and clearly demonstrates the existence of pre-formed BCR clusters on resting B cells, questioning the classical cross-linking model of BCR activation.

Keywords: BCR; Monte Carlo simulation; electron microscopy; immuno-gold-labeling; maximum-likelihood method; oligomerization.


Figures

Figure 1
Figure 1
Scheme of the workflow. The approach is divided into six steps partitioned into experimental (steps 1 and 2), theoretical (steps 3 and 4), and statistical parts (steps 5 and 6). In step 1, the IgD-BCRs on the surface of resting and fixed B cells are stained with immuno-gold and the gold particles visualized by TEM. In step 2, the gold particles are counted, generating an observed gold cluster size distribution. In step 3, the staining process is simulated by Monte-Carlo procedures based on hypothetical BCR nanocluster size distributions, generating characteristic gold particle cluster distributions for the observed gold-labeling. Gold particles are shown in black and BCRs in blue or red (each BCR occupies one square, thus showing a blue 8 mer and a red dimer). In step 4, superposition parameters are estimated based on the observed gold particle distributions by maximum-likelihood estimation. In step 5 based on the estimated parameters, de novo, in silico cluster size distributions are repeatedly generated and the corresponding log-likelihood is re-optimized, providing a histogram of log-likelihood values. Step 6; if in accordance with the data, the theory makes a valid prediction for the underlying BCR nanocluster distribution and the relative amounts of the nanocluster sizes is calculated.
Figure 2
Figure 2
The antibody-coupled gold-reagent is mainly monomeric. (A) The gold-reagent alone was adsorbed onto collodion/carbon-coated EM grids and analyzed by TEM. (B) Analysis of the clustering of 2041 gold particles alone showed 88% monomeric gold particles, 8% of gold particles as close as dimers, 3% were counted as trimers, and 1% as clusters of larger sizes. (C) The gold-reagent cluster size distribution was re-evaluated by our workflow, interpreting the cluster counts as receptor staining. Pre-clustering of the gold-reagent was taken into account. For different assumed receptor oligomer sizes (x-axis) and staining efficiencies (color scale), significance level and p-value were computed (y-axis). Models are rejected above the dashed line corresponding to a p-value of 0.01. The analysis confirms the monomer hypothesis and rejects other hypotheses with p < 0.01 (above the dashed line) for staining efficiencies larger 3%.
Figure 3
Figure 3
The anti-BCR immuno-gold-labeling is specific. (A) The Monte-Carlo simulations were performed for two possible BCR oligomer geometries: a linear and a laminar geometry. (B) J558Lδm/mb-1flN cells expressing the wt IgD-BCR (black line), J558L cells without any BCR (dark gray line) or IgD-hSbap BCR-expressing J558L (light gray line) were labeled with the anti-BCR antibody Ac146 and subsequently stained with FITC-labeled anti-mouse IgG or gold-coupled anti-mouse IgG antibodies. Fluorescently labeled cells were analyzed by flow cytometry, and mean fluorescent intensities (MFI) of the gated populations are given. Gold labeled cells were subjected to replica preparation and analyzed by TEM. The mean gold particle (MGP) number detected on the cell replicas confirms specific labeling of the BCR on wt and IgD-hSbap expressing J558L cells, while immuno-gold-labeling of J558L not expressing BCR does not result in significant gold particle detection on surface replicas.
Figure 4
Figure 4
The IgD-BCR forms differently sized oligomers on the surface of B cells. (A) IgD-BCR-expressing J558Lm/mb-1flN cells were immuno-gold stained using the mouse anti-BCR antibody Ac146 and anti-mouse IgG antibodies coupled to gold particles of 10 nm. The cell overview is given at low magnification (upper left panel), gold-labeling of the cell surface is shown in an overview picture (right panel) and individual gold clusters are shown at high magnification (lower left panel). (B) 66% of the gold particles were present as monomers, 21% formed dimers, 7.5% trimers, and 5.5% were present in clusters of sizes larger than 3. (C) The observed gold particle cluster size distribution was simulated with the assumption of an underlying linear BCR oligomer geometry. Simulations were performed for staining efficiencies of 15 ± 5% indicated by colored lines. The BCR oligomer sizes tested are indicated on the x-axis, and the sigma/p-values for the statistical analysis of each simulation set is given on the y-axis. Different hypothetical BCR oligomer size distributions are tested, namely “one BCR oligomer size only” (x, upper left panel), “BCR monomers + another single BCR oligomer size” (1 + x, upper right panel), “BCR dimers + another single BCR oligomer size” (2 + x, lower left panel), and “BCR monomers, dimers + another single BCR oligomer size” (1 + 2 + x, lower right panel). Models are rejected above the dashed line corresponding to a p-value of 0.01. (D) The observed gold particle cluster size distribution was simulated as in (C) with the assumption of an underlying laminar BCR oligomer geometry. (E) Our simulations predict that 60% of all receptors are part of oligomers of size 18 in a laminar geometry and 40% are BCR dimers. (F) Gold cluster counts (dots with error bars) compared to the prediction of best fitting model (continuous line). The number of counts originating from the different underlying BCR oligomer sizes are shown as dashed lines, indicating that observed clusters up to a size of 3 are primarily caused by BCR dimers, while gold clusters larger than 3 can be explained by BCR clusters of size 18. The impact of BCR monomers is negligible.
Figure 5
Figure 5
The IgD-hSbap BCR mutant forms mainly BCR dimers on the surface of B cells. (A) IgD-hSbap BCR mutant-expressing J558L cells were immuno-gold stained and analyzed as in Figure 4A. (B) 83% of the gold particles were monomeric, 13% formed dimers, and 4% were present in clusters of sizes larger than 2. (C) The observed gold particle cluster size distribution was simulated for different BCR staining efficiencies (x-axis) and different underlying BCR oligomer sizes (color scale). The sigma/p-values for the statistical analysis of each simulation set are given on the y-axis. BCR dimers with a staining efficiency of 8% are identified as the most likely explanation for the observed gold cluster distribution. (D) Simulations were performed as in (C). Assuming a staining efficiency of approximately 8% (color coding), sigma/p-values (y-axis) are plotted for the different BCR oligomer sizes (x-axis). (E) Gold cluster counts (dots with error bars) compared to prediction of best fitting model (continuous line). The number of counts originating from monomers and dimers are shown as dashed lines, indicating that the observed distribution is dominated by BCR dimers. (F) A model with BCR monomers and dimers was fitted to the data, predicting that 90% of all receptors are part of dimers, 10% are monomers.

Similar articles

Cited by

References

    1. Singer SJ, Nicolson GL. The fluid mosaic model of the structure of cell membranes. Science (1972) 175:720–3110.1126/science.175.4023.720 - DOI - PubMed
    1. Simons K, Ikonen E. Functional rafts in cell membranes. Nature (1997) 387:569–7210.1038/42408 - DOI - PubMed
    1. Lingwood D, Simons K. Lipid rafts as a membrane-organizing principle. Science (2010) 327:46–5010.1126/science.1174621 - DOI - PubMed
    1. Alarcon B, Swamy M, van Santen HM, Schamel WWA. T-cell antigen-receptor stoichiometry: pre-clustering for sensitivity. EMBO Rep (2006) 7:490–510.1038/sj.embor.7400682 - DOI - PMC - PubMed
    1. Lillemeier BF, Mortelmaier MA, Forstner MB, Huppa JB, Groves JT, Davis MM. TCR and Lat are expressed on separate protein islands on T cell membranes and concatenate during activation. Nat Immunol (2010) 11:90–610.1038/ni.1832 - DOI - PMC - PubMed

LinkOut - more resources