

From food insufficiency towards trade dependency: a historical analysis of global food availability
- PMID: 24367545
- PMCID: PMC3867377
- DOI: 10.1371/journal.pone.0082714
From food insufficiency towards trade dependency: a historical analysis of global food availability
Abstract
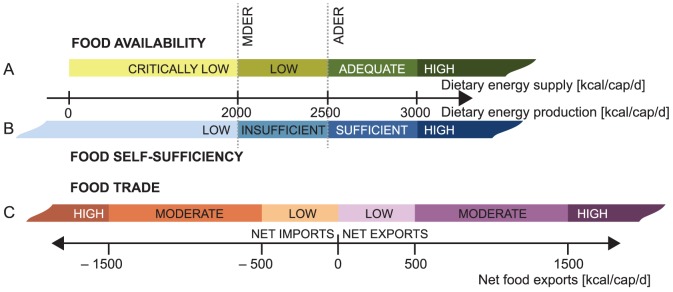
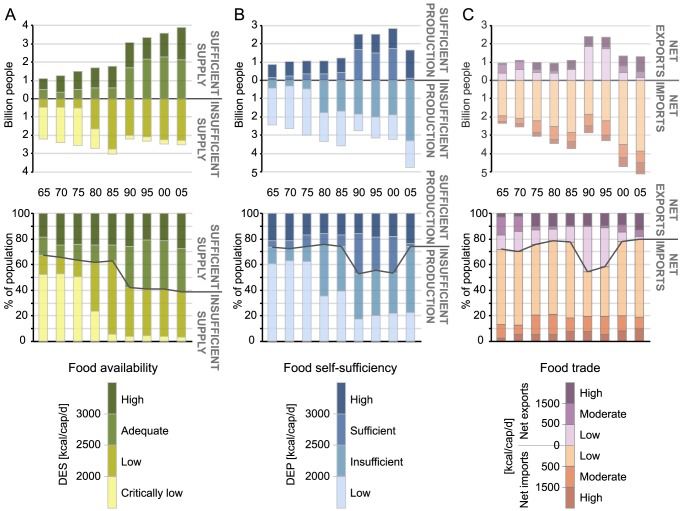
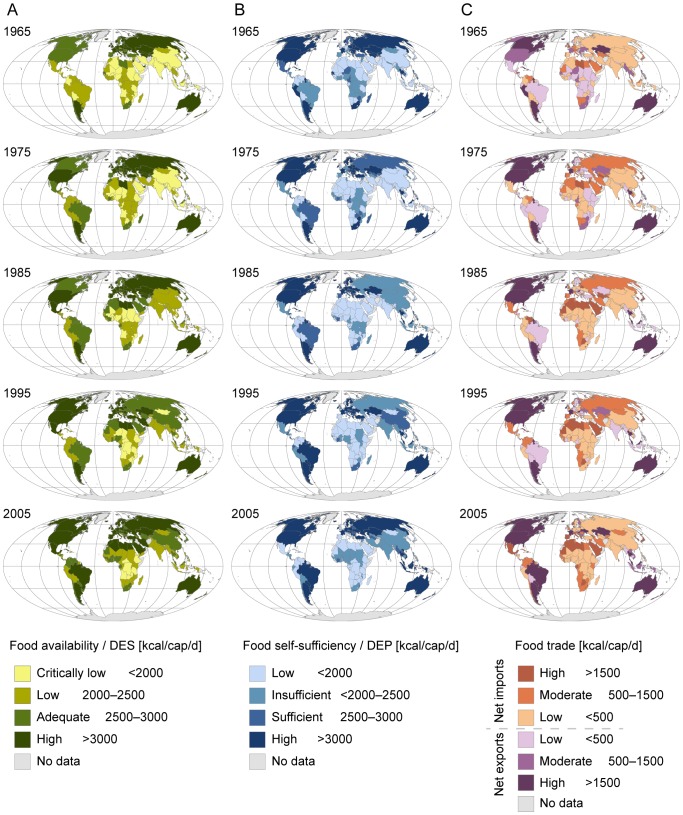
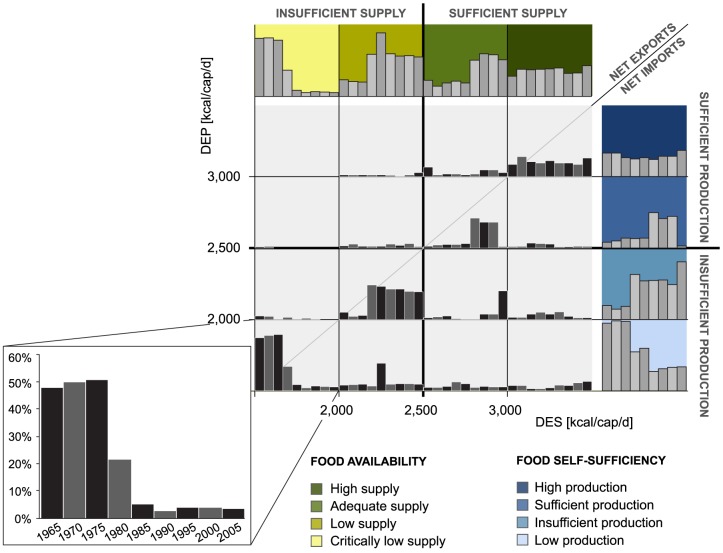
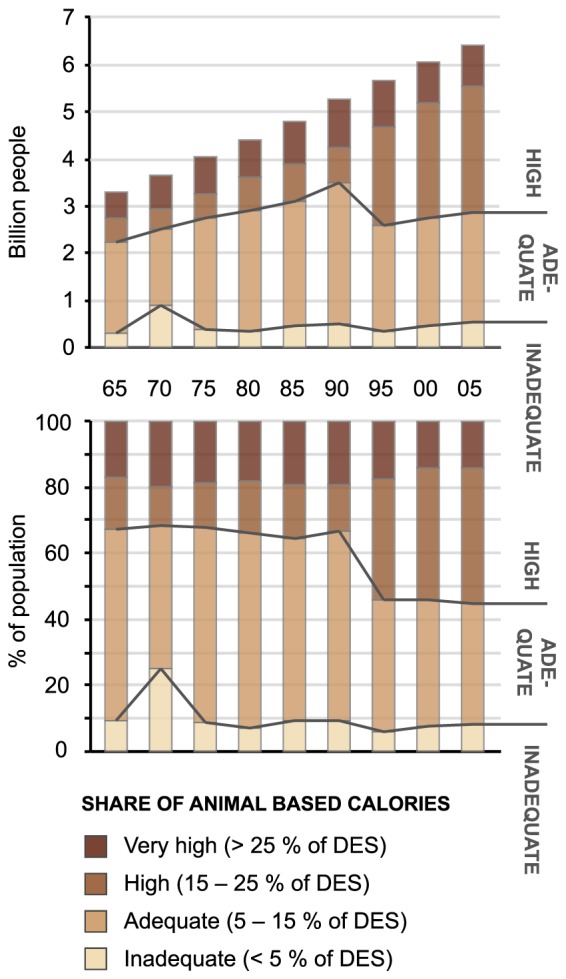
Achieving global food security is one of the major challenges of the coming decades. In order to tackle future food security challenges we must understand the past. This study presents a historical analysis of global food availability, one of the key elements of food security. By calculating national level dietary energy supply and production for nine time steps during 1965-2005 we classify countries based on their food availability, food self-sufficiency and food trade. We also look at how diets have changed during this period with regard to supply of animal based calories. Our results show that food availability has increased substantially both in absolute and relative terms. The percentage of population living in countries with sufficient food supply (>2500 kcal/cap/d) has almost doubled from 33% in 1965 to 61% in 2005. The population living with critically low food supply (<2000 kcal/cap/d) has dropped from 52% to 3%. Largest improvements are seen in the MENA region, Latin America, China and Southeast Asia. Besides, the composition of diets has changed considerably within the study period: the world population living with high supply of animal source food (>15% of dietary energy supply) increased from 33% to over 50%. While food supply has increased globally, food self-sufficiency (domestic production>2500 kcal/cap/d) has not changed remarkably. In the beginning of the study period insufficient domestic production meant insufficient food supply, but in recent years the deficit has been increasingly compensated by rising food imports. This highlights the growing importance of food trade, either for food supply in importing countries or as a source of income for exporters. Our results provide a basis for understanding past global food system dynamics which, in turn, can benefit research on future food security.
Conflict of interest statement
Figures
References
-
- UN (2011) World Population Prospects, The 2010 Revision, Population Division of the Department of Economic and Social Affairs of the United Nations (UN) Secretariat. Available: http://esa.un.org/unpp. Accessed 2012 Sep 17.
-
- Rosegrant MW, Ringler C, Zhu T (2009) Water for Agriculture: Maintaining Food Security under Growing Scarcity. Annual Review of Environment and Resources 34: 205–222 10.1146/annurev.environ.030308.090351 - DOI
-
- Hertel TW (2011) The Global Supply and Demand for Agricultural Land in 2050: A Perfect Storm in the Making? Am J Agr Econ 93: 259–275 10.1093/ajae/aaq189 - DOI
Publication types
MeSH terms
LinkOut - more resources
Full Text Sources
Other Literature Sources
Research Materials
Miscellaneous
