. 2013 Dec 19;8(12):e82872.
doi: 10.1371/journal.pone.0082872. eCollection 2013.

Identification of poly(ADP-ribose) polymerase-1 as a cell cycle regulator through modulating Sp1 mediated transcription in human hepatoma cells

Affiliations

Identification of poly(ADP-ribose) polymerase-1 as a cell cycle regulator through modulating Sp1 mediated transcription in human hepatoma cells

Liu Yang et al. PLoS One. .

Abstract

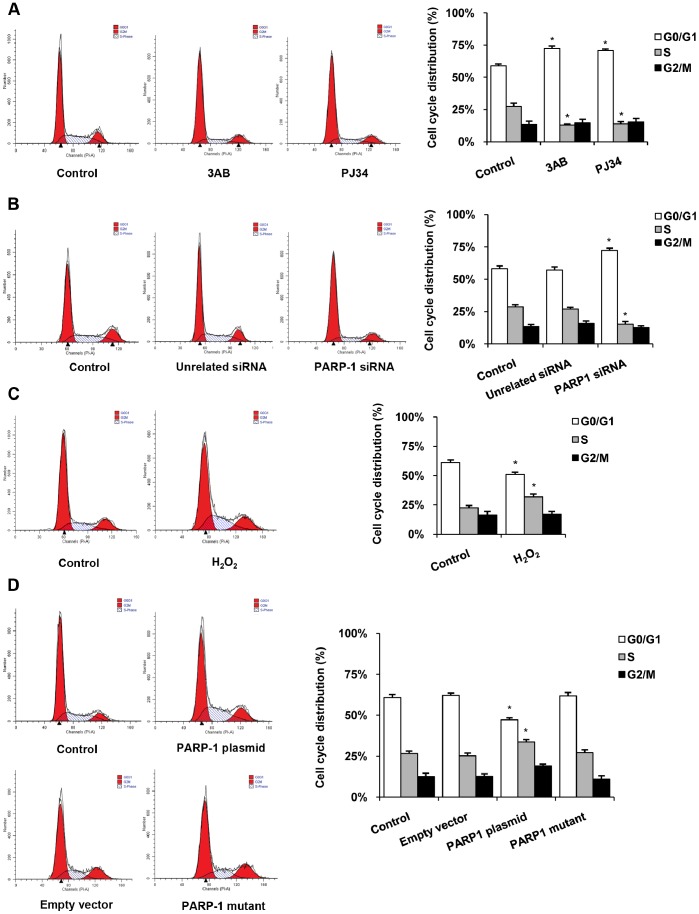
The transcription factor Sp1 is implicated in the activation of G0/G1 phase genes. Modulation of Sp1 transcription activities may affect G1-S checkpoint, resulting in changes in cell proliferation. In this study, our results demonstrated that activated poly(ADP-ribose) polymerase 1 (PARP-1) promoted cell proliferation by inhibiting Sp1 signaling pathway. Cell proliferation and cell cycle assays demonstrated that PARP inhibitors or PARP-1 siRNA treatment significantly inhibited proliferation of hepatoma cells and induced G0/G1 cell cycle arrest in hepatoma cells, while overexpression of PARP-1 or PARP-1 activator treatment promoted cell cycle progression. Simultaneously, inhibition of PARP-1 enhanced the expression of Sp1-mediated checkpoint proteins, such as p21 and p27. In this study, we also showed that Sp1 was poly(ADP-ribosyl)ated by PARP-1 in hepatoma cells. Poly(ADP-ribosyl)ation suppressed Sp1 mediated transcription through preventing Sp1 binding to the Sp1 response element present in the promoters of target genes. Taken together, these data indicated that PARP-1 inhibition attenuated the poly(ADP-ribosyl)ation of Sp1 and significantly increased the expression of Sp1 target genes, resulting in G0/G1 cell cycle arrest and the decreased proliferative ability of the hepatoma cells.


Conflict of interest statement

Competing Interests: The authors have declared that no competing interests exist.

Figures

Figure 1
Figure 1. PARP-1 promoted proliferation of HepG2 cells.
Cell proliferation assay was performed, in which Edu-labeled proliferative cells (red) and Hoechst-stained nuclei (blue) were observed under a fluorescent microscope (scale bar = 100 µm). Cells were treated with vehicles (PBS), 3AB (10 mmol/L, 24 h), PJ34 (10 µmol/L, 24 h) (A), PARP-1 siRNA (50 nmol/L, 48 h) (B), H2O2 (300 µmol/L, 0.5 h) (C), wild-type PARP-1 expressing plasmid (1 mg/L, 48 h) or PARP-1 mutant plasmid (1 mg/L, 48 h) (D) respectively. Data shown are representative of six independent experiments and are expressed as the mean±SEM, *p<0.05 compared to control group.
Figure 2
Figure 2. PARP-1 prevented cell cycle arrest.
Cell cycle distribution was obtained by use of PI staining and analysis under a FACS Calibur flow cytometer. Cells were treated with vehicles (PBS), 3AB (10 mmol/L, 24 h), PJ34 (10 µmol/L, 24 h) (A), PARP-1 siRNA (50 nmol/L, 48 h) (B), H2O2 (300 µmol/L, 0.5 h) (C), PARP-1 expressing plasmid (1 mg/L, 48 h) or PARP-1 mutant plasmid (1 mg/L, 48 h) (D) respectively. Data shown are representative of six independent experiments and are expressed as the mean±SEM, *p<0.05 compared to control group.
Figure 3
Figure 3. PARP-1 prevented Sp1-mediated gene transcription.
Real-time PCR (A–D) and Western blotting (E–F) were used to detect expression of genes, as indicated in the figure. Cells were treated with vehicles (PBS), 3AB (10 mmol/L, 24 h), PJ34 (10 µmol/L, 24 h) (A, E), PARP-1 siRNA (50 nmol/L, 48 h) (B, E), H2O2 (300 µmol/L, 0.5 h) (C, F), PARP-1 expressing plasmid (1 mg/L, 48 h) or PARP-1 mutant plasmid (1 mg/L, 48 h) (D, F) respectively. Data shown are representative of six independent experiments and are expressed as the mean±SEM, *p<0.05, **p<0.01 compared to control group.
Figure 4
Figure 4. Inhibition of PARP-1 decreased the poly(ADP-ribosyl)ation of Sp1.
(A) Immunoprecipitation of Sp1 bound proteins from HepG2 nuclear extracts, followed by western blotting using anti-PAR antibody. (B) Immunoprecipitation of poly(ADP-ribosyl)ated bound proteins from HepG2 nuclear extracts, followed by western blotting using anti-Sp1 antibody. Unspecific IgG served as negative control. (C–F) Immunoprecipitation of Sp1 bound proteins from HepG2 cells followed by western blotting using anti-PAR antibody. Cells were treated with vehicles (PBS), 3AB (10 mmol/L, 24 h), PJ34 (10 µmol/L, 24 h) (C), PARP-1 siRNA (50 nmol/L, 48 h) (D), H2O2 (300 µmol/L, 0.5 h) (E), PARP-1 expressing plasmid or PARP-1 mutant plasmid (1 mg/L, 48 h) (F) respectively. Sp1 served as loading control.
Figure 5
Figure 5. Poly(ADP-ribosyl)ation inhibited Sp1-DNA complex formation.
(A–D) EMSA assay of HepG2 nuclear extracts was performed by use of an oligonucleotide probe containing Sp1 binding site. Cells were treated with vehicles (PBS), 3AB (10 mmol/L, 24 h), PJ34 (10 µmol/L, 24 h) (A), PARP-1 siRNA (50 nmol/L, 48 h) (B), H2O2 (300 µmol/L, 0.5 h) (C), PARP-1 expressing plasmid or PARP-1 mutant plasmid (1 mg/L, 48 h) (D) respectively. (E–H) ChIP assay was performed to see the recruitment of Sp1 to p21 promoter using specific anti-Sp1 antibody versus anti-IgG antibody. Quantitative real-time PCR was used to quantify the enrichment of endogenous p21 promoter loci. Cells were treated with vehicles (PBS), 3AB (10 mmol/L, 24 h), PJ34 (10 µmol/L, 24 h) (E), PARP-1 siRNA (50 nmol/L, 48 h) (F), H2O2 (300 µmol/L, 0.5 h) (G), PARP-1 expressing plasmid or PARP-1 mutant plasmid (1 mg/L, 48 h) (H) respectively. Data shown are representative of six independent experiments and are expressed as the mean±SEM, *p<0.05 compared to control group.
Figure 6
Figure 6. Inhibition of PARP-1 prevented Sp1-mediated transactivation.
Luciferase assay was used to detect wild type or mutant Sp1-responsive luciferase reporter activity in HepG2 cell. The empty vector pGL2T+I served as negative control. Cells were treated with vehicles (PBS), 3AB (10 mmol/L, 24 h), PJ34 (10 µmol/L, 24 h) (A), PARP-1 siRNA (50 nmol/L, 48 h) (B), H2O2 (300 µmol/L, 0.5 h) (C), PARP-1 expressing plasmid or PARP-1 mutant plasmid (1 mg/L, 48 h) (D) respectively. Data representative of six independent experiments and are expressed as the mean±SEM, *p<0.05 compared to control group.

References

    1. Kadonaga JT, Carner KR, Masiarz FR, Tjian R (1987) Isolation of cDNA encoding transcription factor Sp1 and functional analysis of the DNA binding domain. Cell 51: 1079–1090. - PubMed
    1. Black AR, Black JD, Azizkhan-Clifford J (2001) Sp1 and kruppel-like factor family of transcription factors in cell growth regulation and cancer. J Cell Physiol 188: 143–160. - PubMed
    1. Song J, Ugai H, Ogawa K, Wang Y, Sarai A, et al. (2001) Two consecutive zinc fingers in Sp1 and in MAZ are essential for interactions with cis-elements. J Biol Chem 276: 30429–30434. - PubMed
    1. Tapias A, Ciudad CJ, Roninson IB, Noe V (2008) Regulation of Sp1 by cell cycle related proteins. Cell Cycle 7: 2856–2867. - PMC - PubMed
    1. Feng XH, Lin X, Derynck R (2000) Smad2, Smad3 and Smad4 cooperate with Sp1 to induce p15(Ink4B) transcription in response to TGF-beta. EMBO J 19: 5178–5193. - PMC - PubMed

Publication types

MeSH terms

Substances