

Variance in brain volume with advancing age: implications for defining the limits of normality
- PMID: 24367629
- PMCID: PMC3868601
- DOI: 10.1371/journal.pone.0084093
Variance in brain volume with advancing age: implications for defining the limits of normality
Erratum in
- PLoS One. 2014;9(1). doi:10.1371/annotation/21fb1298-a831-423f-a247-205641dda40c
Abstract
Background: Statistical models of normal ageing brain tissue volumes may support earlier diagnosis of increasingly common, yet still fatal, neurodegenerative diseases. For example, the statistically defined distribution of normal ageing brain tissue volumes may be used as a reference to assess patient volumes. To date, such models were often derived from mean values which were assumed to represent the distributions and boundaries, i.e. percentile ranks, of brain tissue volume. Since it was previously unknown, the objective of the present study was to determine if this assumption was robust, i.e. whether regression models derived from mean values accurately represented the distributions and boundaries of brain tissue volume at older ages.
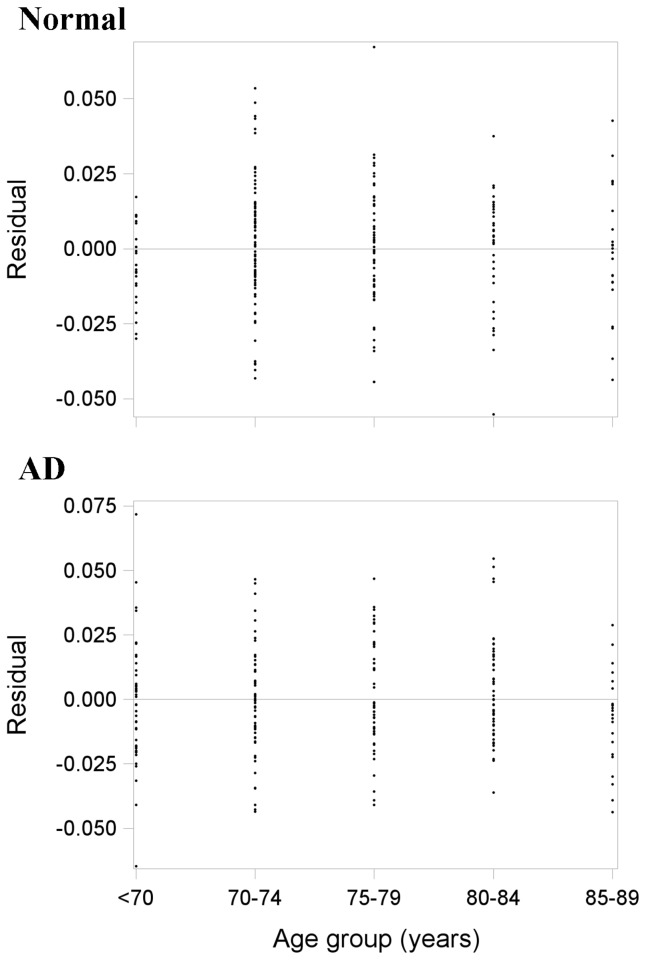
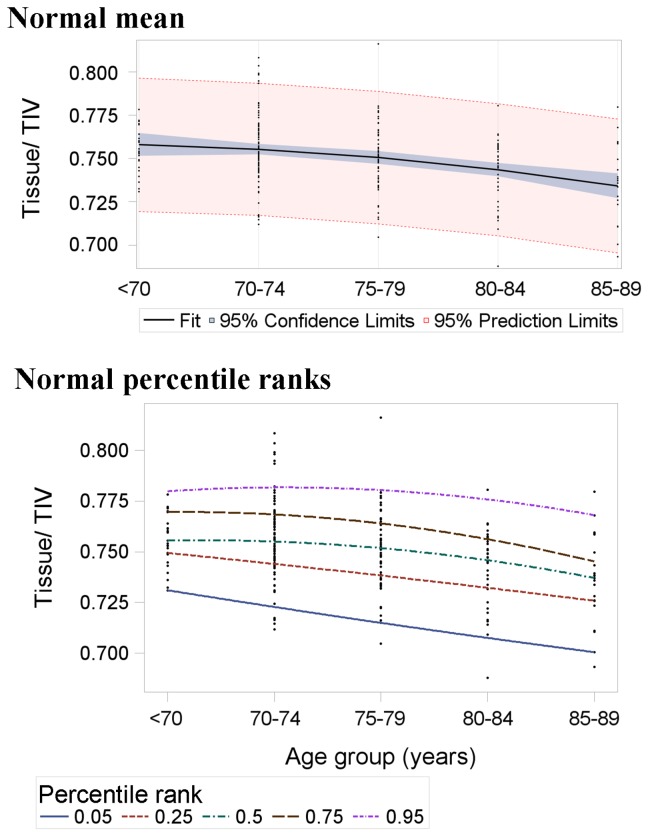
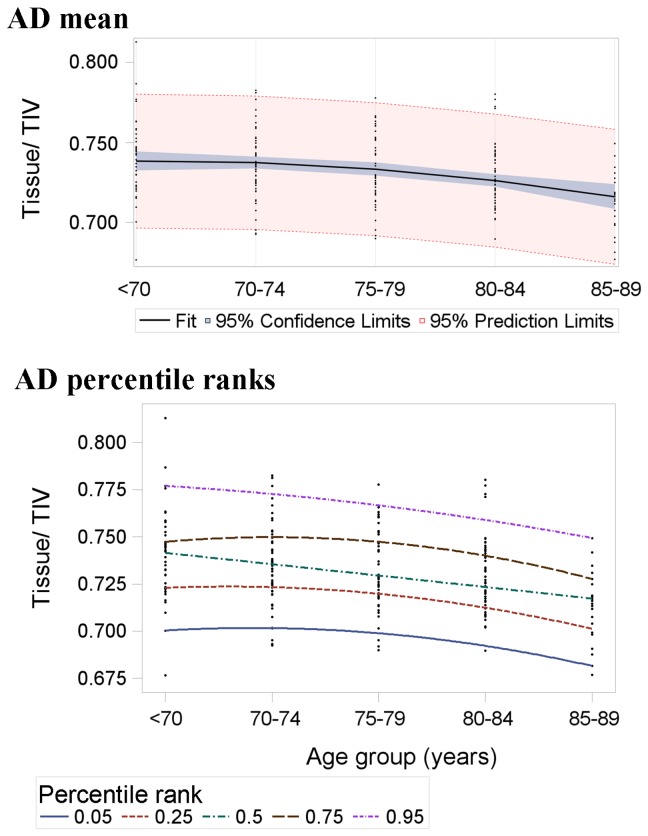
Materials and methods: We acquired T1-w magnetic resonance (MR) brain images of 227 normal and 219 Alzheimer's disease (AD) subjects (aged 55-89 years) from publicly available databanks. Using nonlinear regression within both samples, we compared mean and percentile rank estimates of whole brain tissue volume by age.
Results: In both the normal and AD sample, mean regression estimates of brain tissue volume often did not accurately represent percentile rank estimates (errors=-74% to 75%). In the normal sample, mean estimates generally underestimated differences in brain volume at percentile ranks below the mean. Conversely, in the AD sample, mean estimates generally underestimated differences in brain volume at percentile ranks above the mean. Differences between ages at the 5(th) percentile rank of normal subjects were ~39% greater than mean differences in the AD subjects.
Conclusions: While more data are required to make true population inferences, our results indicate that mean regression estimates may not accurately represent the distributions of ageing brain tissue volumes. This suggests that percentile rank estimates will be required to robustly define the limits of brain tissue volume in normal ageing and neurodegenerative disease.
Conflict of interest statement
Figures
References
-
- Selkoe DJ (2013) The Therapeutics of Alzheimer’s Disease: Where We Stand and Where We are Heading Ann Neurol Accepted Article ( Accepted, unedited articles published online and citable. The final edited and typeset version of record will appear in future): page numbers not yet assigned. - PubMed
Publication types
MeSH terms
Grants and funding
- P50 AG05681/AG/NIA NIH HHS/United States
- P20 MH071616/MH/NIMH NIH HHS/United States
- U01 AG024904/AG/NIA NIH HHS/United States
- CAPMC/ CIHR/Canada
- G1001245/MRC_/Medical Research Council/United Kingdom
- P01 AG03991/AG/NIA NIH HHS/United States
- MR/K026992/1/MRC_/Medical Research Council/United Kingdom
- G0701120/MRC_/Medical Research Council/United Kingdom
- R01 AG021910/AG/NIA NIH HHS/United States
- P30 AG010129/AG/NIA NIH HHS/United States
- P50 MH071616/MH/NIMH NIH HHS/United States
- K01 AG030514/AG/NIA NIH HHS/United States
- U24 RR021382/RR/NCRR NIH HHS/United States
- P01 AG003991/AG/NIA NIH HHS/United States
- P50 AG005681/AG/NIA NIH HHS/United States
LinkOut - more resources
Full Text Sources
Other Literature Sources
Medical
