

Comparison of SSR and SNP markers in estimation of genetic diversity and population structure of Indian rice varieties
- PMID: 24367635
- PMCID: PMC3868579
- DOI: 10.1371/journal.pone.0084136
Comparison of SSR and SNP markers in estimation of genetic diversity and population structure of Indian rice varieties
Abstract
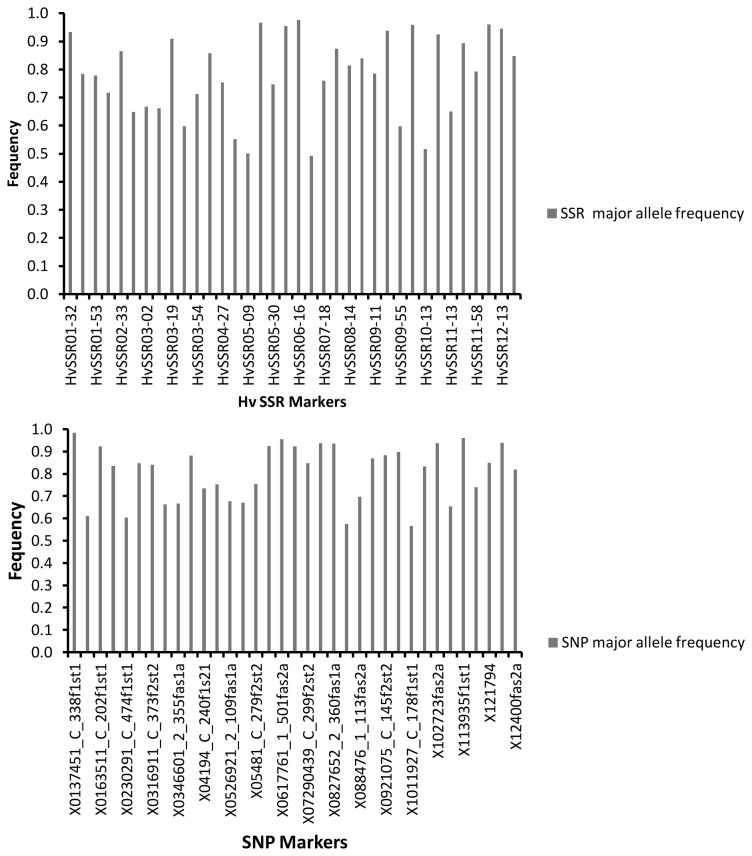
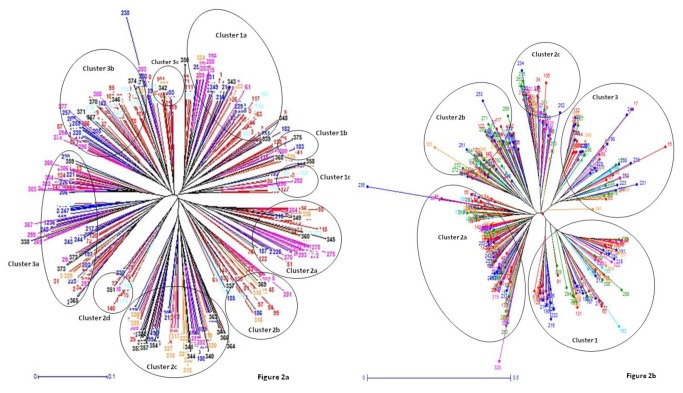
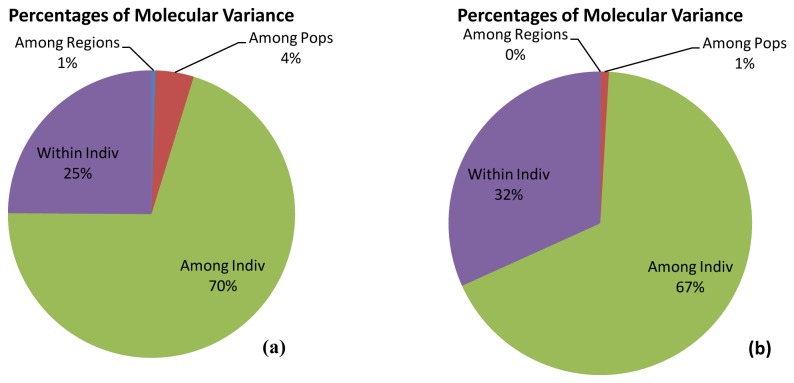
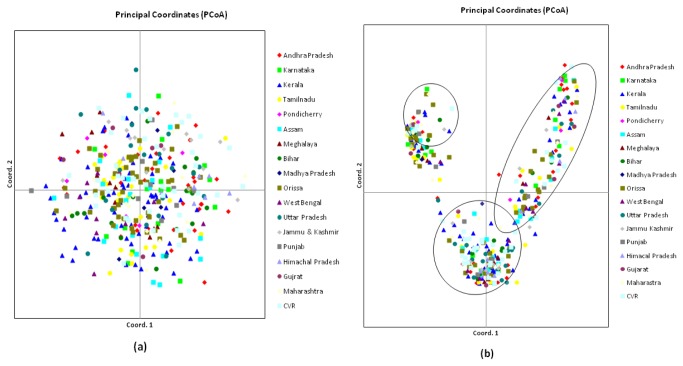
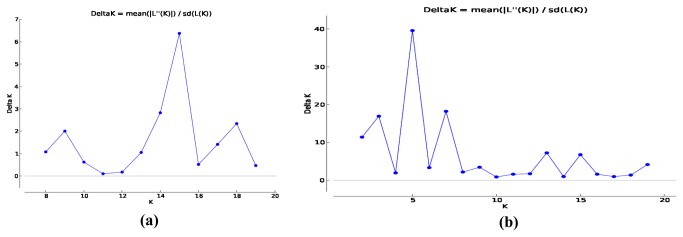
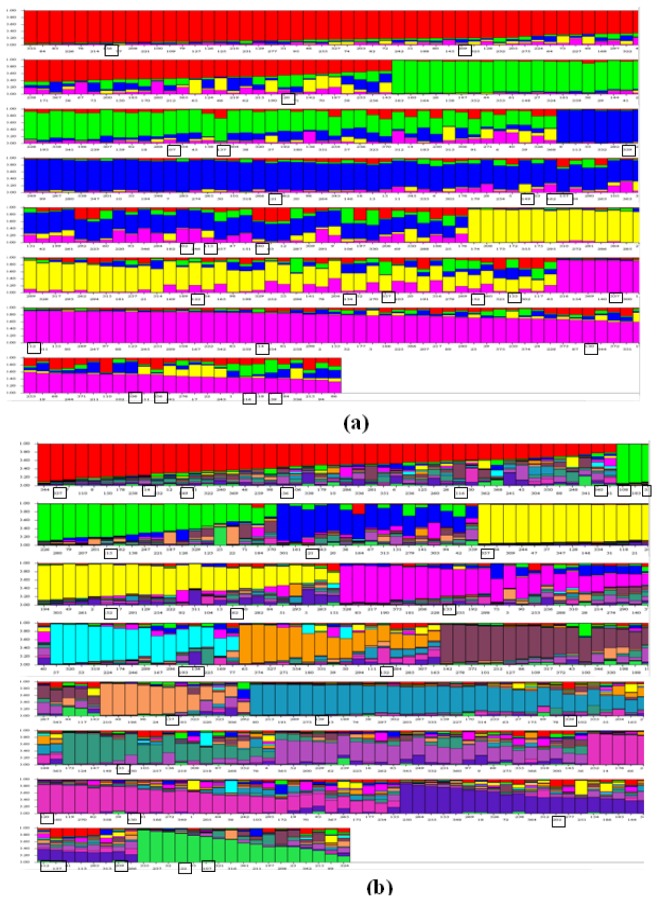
Simple sequence repeat (SSR) and Single Nucleotide Polymorphic (SNP), the two most robust markers for identifying rice varieties were compared for assessment of genetic diversity and population structure. Total 375 varieties of rice from various regions of India archived at the Indian National GeneBank, NBPGR, New Delhi, were analyzed using thirty six genetic markers, each of hypervariable SSR (HvSSR) and SNP which were distributed across 12 rice chromosomes. A total of 80 alleles were amplified with the SSR markers with an average of 2.22 alleles per locus whereas, 72 alleles were amplified with SNP markers. Polymorphic information content (PIC) values for HvSSR ranged from 0.04 to 0.5 with an average of 0.25. In the case of SNP markers, PIC values ranged from 0.03 to 0.37 with an average of 0.23. Genetic relatedness among the varieties was studied; utilizing an unrooted tree all the genotypes were grouped into three major clusters with both SSR and SNP markers. Analysis of molecular variance (AMOVA) indicated that maximum diversity was partitioned between and within individual level but not between populations. Principal coordinate analysis (PCoA) with SSR markers showed that genotypes were uniformly distributed across the two axes with 13.33% of cumulative variation whereas, in case of SNP markers varieties were grouped into three broad groups across two axes with 45.20% of cumulative variation. Population structure were tested using K values from 1 to 20, but there was no clear population structure, therefore Ln(PD) derived Δk was plotted against the K to determine the number of populations. In case of SSR maximum Δk was at K=5 whereas, in case of SNP maximum Δk was found at K=15, suggesting that resolution of population was higher with SNP markers, but SSR were more efficient for diversity analysis.
Conflict of interest statement
Figures
References
-
- Kennedy G, Burlingame B (2003) Analysis of food composition data on rice from a plant genetic resources perspective. Food Chem 80: 589–596. doi:10.1016/S0308-8146(02)00507-1. - DOI
-
- Lu H, Redus MA, Coburn JR, Rutger JN, Mc Couch SR et al. (2005) Population structure and breeding patterns of 145 U.S. rice cultivars based on SSR marker analysis. Crop Sci 45: 66-76. doi:10.2135/cropsci2005.0066. - DOI
-
- Coombs JJ, Frank LM, Souches DS (2004) An applied fingerprinting system for cultivated potato using simple sequence repeats. Am J of Potato Res 81: 243-250. doi:10.1007/BF02871765. - DOI
Publication types
MeSH terms
Substances
LinkOut - more resources
Full Text Sources
Other Literature Sources
