

A linear combination of pharmacophore hypotheses as a new tool in search of new active compounds--an application for 5-HT1A receptor ligands
- PMID: 24367669
- PMCID: PMC3867515
- DOI: 10.1371/journal.pone.0084510
A linear combination of pharmacophore hypotheses as a new tool in search of new active compounds--an application for 5-HT1A receptor ligands
Abstract
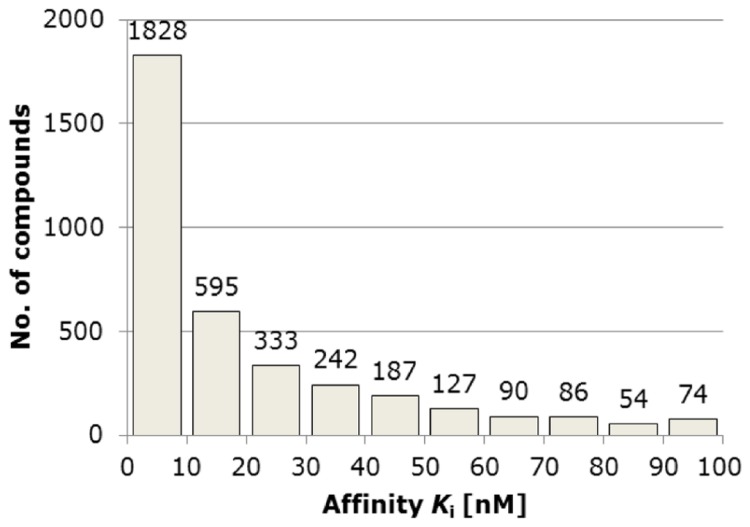
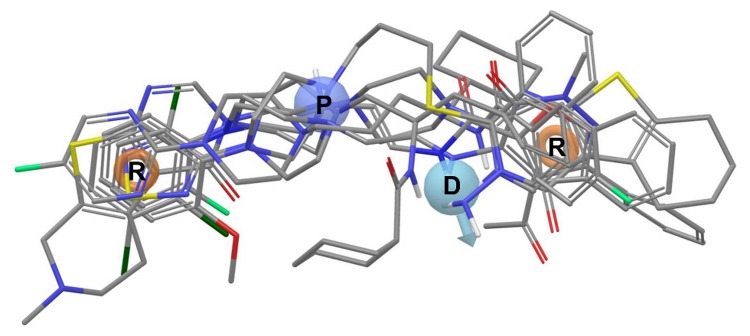
This study explores a new approach to pharmacophore screening involving the use of an optimized linear combination of models instead of a single hypothesis. The implementation and evaluation of the developed methodology are performed for a complete known chemical space of 5-HT1AR ligands (3616 active compounds with K i < 100 nM) acquired from the ChEMBL database. Clusters generated from three different methods were the basis for the individual pharmacophore hypotheses, which were assembled into optimal combinations to maximize the different coefficients, namely, MCC, accuracy and recall, to measure the screening performance. Various factors that influence filtering efficiency, including clustering methods, the composition of test sets (random, the most diverse and cluster population-dependent) and hit mode (the compound must fit at least one or two models from a final combination) were investigated. This method outmatched both single hypothesis and random linear combination approaches.
Conflict of interest statement
Figures


Similar articles
-
Application of quantitative structure-activity relationship models of 5-HT1A receptor binding to virtual screening identifies novel and potent 5-HT1A ligands.J Chem Inf Model. 2014 Feb 24;54(2):634-47. doi: 10.1021/ci400460q. Epub 2014 Feb 12. J Chem Inf Model. 2014. PMID: 24410373 Free PMC article.
-
Probabilistic Approach for Virtual Screening Based on Multiple Pharmacophores.Molecules. 2020 Jan 17;25(2):385. doi: 10.3390/molecules25020385. Molecules. 2020. PMID: 31963467 Free PMC article.
-
Pharmacophore-based 3D QSAR studies on a series of high affinity 5-HT1A receptor ligands.Eur J Med Chem. 2010 Apr;45(4):1508-14. doi: 10.1016/j.ejmech.2009.12.059. Epub 2010 Jan 13. Eur J Med Chem. 2010. PMID: 20133028
-
Computational methods in determination of pharmacophore models of 5-HT(1A), 5-HT(2A) and 5-HT(7) receptors.Mini Rev Med Chem. 2013 Jun;13(7):933-51. doi: 10.2174/1389557511313070001. Mini Rev Med Chem. 2013. PMID: 23544602 Review.
-
5-HT1A receptor ligands and their therapeutic applications: review of new patents.Expert Opin Ther Pat. 2018 Sep;28(9):679-689. doi: 10.1080/13543776.2018.1514011. Epub 2018 Sep 7. Expert Opin Ther Pat. 2018. PMID: 30124346 Review.
Cited by
-
Discriminating agonist and antagonist ligands of the nuclear receptors using 3D-pharmacophores.J Cheminform. 2016 Sep 6;8(1):43. doi: 10.1186/s13321-016-0154-2. eCollection 2016. J Cheminform. 2016. PMID: 27602059 Free PMC article.
-
An Algorithm to Identify Target-Selective Ligands - A Case Study of 5-HT7/5-HT1A Receptor Selectivity.PLoS One. 2016 Jun 7;11(6):e0156986. doi: 10.1371/journal.pone.0156986. eCollection 2016. PLoS One. 2016. PMID: 27271158 Free PMC article.
-
Three-dimensional descriptors for aminergic GPCRs: dependence on docking conformation and crystal structure.Mol Divers. 2019 Aug;23(3):603-613. doi: 10.1007/s11030-018-9894-4. Epub 2018 Nov 27. Mol Divers. 2019. PMID: 30484023 Free PMC article.
-
From Homology Models to a Set of Predictive Binding Pockets-a 5-HT1A Receptor Case Study.J Chem Inf Model. 2017 Feb 27;57(2):311-321. doi: 10.1021/acs.jcim.6b00263. Epub 2017 Jan 18. J Chem Inf Model. 2017. PMID: 28055203 Free PMC article.
-
Synthesis and anticonvulsant activity of phenoxyacetyl derivatives of amines, including aminoalkanols and amino acids.Medchemcomm. 2018 Oct 19;9(11):1933-1948. doi: 10.1039/c8md00430g. eCollection 2018 Nov 1. Medchemcomm. 2018. PMID: 30568761 Free PMC article.
References
-
- IUPAC Glossary of Terms used in Medicinal Chemistry. Available: http:// www.chem.qmul.ac.uk/iupac/medchem. (Accessed March 27, 2012)
-
- Ren J-X, Li L-L, Zheng R-L, Xie H-Z, Cao Z-X et al. (2011) Discovery of novel Pim-1 kinase inhibitors by a hierarchical multistage virtual screening approach based on SVM model, pharmacophore, and molecular docking. J Chem Inf Model 51: 1364–1375. doi:10.1021/ci100464b. PubMed: 21618971. - DOI - PubMed
-
- Brunskole Svegelj M, Turk S, Brus B, Lanisnik Rizner T, Stojan J et al. (2011) Novel inhibitors of trihydroxynaphthalene reductase with antifungal activity identified by ligand-based and structure-based virtual screening. J Chem Inf Model 51: 1716–1724. doi:10.1021/ci2001499. PubMed: 21667970. - DOI - PubMed
Publication types
MeSH terms
Substances
LinkOut - more resources
Full Text Sources
Other Literature Sources
