. 2013 Dec 24:1:85.
doi: 10.1186/2051-5960-1-85.

T cell-activation in neuromyelitis optica lesions plays a role in their formation

Affiliations

T cell-activation in neuromyelitis optica lesions plays a role in their formation

Maria Pohl et al. Acta Neuropathol Commun. .

Abstract

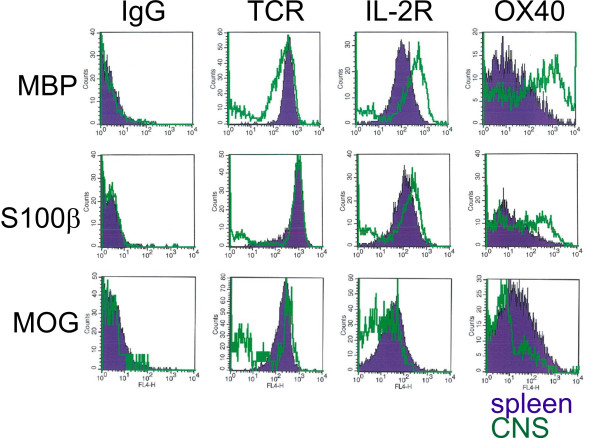
Background: Neuromyelitis optica (NMO) is an inflammatory demyelinating disease of the central nervous system (CNS), which is characterized by the presence of pathogenic serum autoantibodies against aquaporin 4 (AQP4) in the vast majority of patients. The contribution of T cells to the formation of astrocyte destructive lesions is currently unclear. However, active human NMO lesions contain CD4+ T-lymphocytes expressing the activation marker Ox40, and the expression is more profound compared to that seen in MS lesions of comparable activity. Therefore, we analyzed the role of T-cell activation within the CNS in the initiation of NMO lesions in an experimental model of co-transfer of different encephalitogenic T-cells and human AQP4 antibody containing NMO immunoglobulin (NMO IgG). We further studied the expression of the T-cell activation marker Ox40 in NMO and multiple sclerosis lesions in different stages of activity.

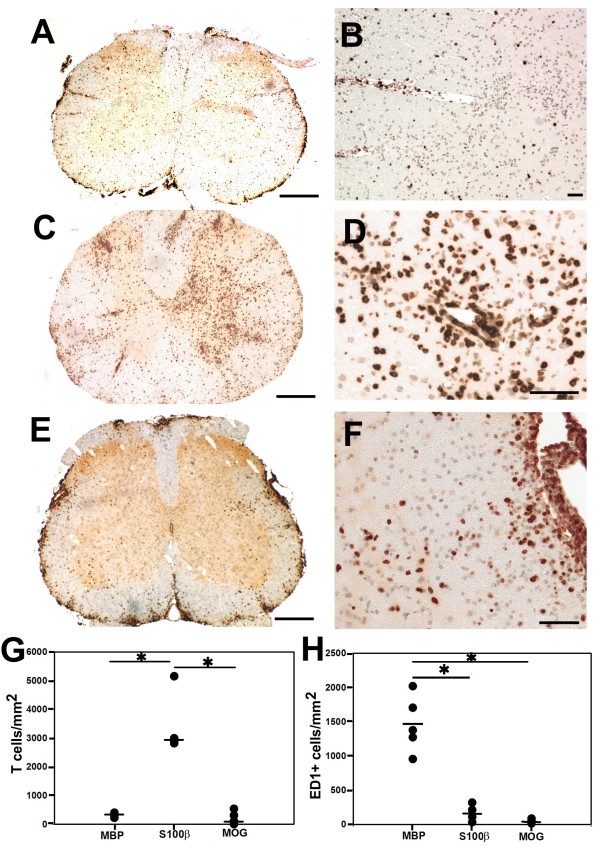
Results: All encephalitogenic T-cell lines used in our experiments induced brain inflammation with a comparable extent of blood brain barrier damage, allowing human NMO IgG to penetrate into the brain and spinal cord tissue. However, astrocyte destructive NMO lesions were only seen with T-cells, which showed signs of activation in the lesions. T-cell activation was reflected by the expression of the activation marker Ox40 and pronounced production of γ-IFN, which was able to increase the production of complement proteins and of the Fc gamma III receptor (Fcgr3) and decreased production of complement inhibitory protein Factor H in microglia.

Conclusions: Our data indicate that local activation of T-cells provide an inflammatory environment in the CNS, which allows AQP4 auto-antibodies to induce astrocyte destructive NMO-like lesions.


Figures

Figure 1
Figure 1
Ox40 expression by T cells in NMO lesions. (A-C) Confocal microscopy of a perivascular early active NMO lesion stained with antibodies against Ox40 (A, red) and CD3 (B, green) (overlay C, yellow). The Ox40 antigen is expressed by a subset of T cells (white arrow). (D-F): Further stainings of NMO lesions with antibodies against Ox40 (brown) and CD8 (blue) (D-E) or CD4 (blue, F) reveals a complete absence of Ox40 expression on CD8+ T cells, both in perivascular lesions (D) and in the parenchyma at the edge of a demyelinating lesion (E). In contrast, Ox40 products are expressed by CD4+ T cells (purple), as seen in this perivascular lesion. Bars: 25 μm (A-C) and 50 μm (D-F).
Figure 2
Figure 2
Differences in Ox40 expression by CD4+ T cells between NMO and MS lesions. Inflammatory lesions derived from spinal cords of NMO (A,B,C) and MS patients (D,E,F), and from brains of NMO (G,H,I) and MS patients (J,K,L) were reacted with antibodies specific for AQP4 (brown reaction product; counterstaining with hematoxylin reveals nuclei in blue; A,G), CD3 (brown reaction product; B,E,H,K), Ox40 (brown reaction product; C,F,I,L) or were stained with Kluever-Barrera to reveal myelin (blue; D,J). The spinal cord lesions shown are early active, as revealed by the large number of granulocytes in NMO (inlay in A) and by the presence of myelin degradation products in macrophages in MS (D). The brain lesions shown are late active in NMO, and early active, as revealed by macrophages containing myelin degradation products in MS (inlay in J). The inlays in I and L show Ox40+ T cells. In early active NMO lesions, 18% of all perivascular and 24% of all parenchymal OX40+ cells also express the proliferating cell nuclear antigen PCNA (M-O; PCNA visualized by the dark blue, Ox 40 by the brown reaction product).
Figure 3
Figure 3
Numbers of Ox40+ and CD3+ T cells in NMO and MS lesions at different lesion stages. The number of Ox40 (A,B) and CD3 (C,D) positive T cells of 7 NMO (A,C) and 9 MS (B,D) cases was determined by evaluating regions of interest in NMO (ROI n = 144) and MS (ROI n = 112) (each region = 390.000 μm2) in spinal cord and brain lesions/inflamed parenchyma. Asterisks indicate statistically significant (p < 0,05; Mann Whitney U test with asymptotic significance (2 tailed)) differences between early active (n = 35) and inactive (n = 29) NMO lesions in the numbers of Ox40+ T cells (A) and CD3+ T cells (C). The differences between early active (n = 51) and inactive (n = 34) MS lesions in the numbers of Ox40+ T cells (B) and CD3+ T cells (D) were not significant (p = 0,57 and p = 0,107, respectively). Please note that the differences in numbers of Ox40+ T cells and CD3+ T cells between early active NMO (n = 35) and early active MS (n = 51) is also highly significant (p < 0,0001 and p = 0,000318, respectively).
Figure 4
Figure 4
T cells with different CNS antigen-specificity are activated to different extent in the CNS. Analysis of surface markers by flow cytometry. Histograms are shown. GFP-labeled MBP-, S100β-, and MOG-specific T cells isolated from the spleen (blue) or spinal cord (green) of recipient rats were isolated at the acute phase of clinical symptoms and analyzed for the expression of T cell receptors (TCR), interleukin-2 receptors (IL-2R) or the Ox40 antigen, using specific antibodies for these molecules and an isotype control (IgG). MBP-specific T cells were strongly activated, as evidenced by a down-regulation of TCR, and an up-regulation of IL-2R and the Ox40 antigen. S100β-specific T cells showed an intermediated degree of activation (i.e. no downregulation of TCR, weak up-regulation of IL-2R and Ox40 antigen), and MOG-specific T cells were not noticeably activated, as revealed by the lack of upregulation of IL-2R and the Ox40 antigen).
Figure 5
Figure 5
T cells infiltration of the spinal cord following the initiation of NMO-like lesions in NMO-IgG seropositive animals by T cells with different CNS antigen-specificities. (A-F) T cells specific for MBP (A,B), S100β (C,D) and MOG (E,F) were used to induce CNS inflammation, followed by transfer of NMO-IgG 4 days later. The animals were sacrificed 5 days after T cell transfer. For histological evaluation, their spinal cords were reacted with anti-CD3 antibodies (brown reaction product) and counterstained with hematoxylin to reveal nuclei (blue). bars = 500 μm (A,C,E) and 100 μm (B,D,F). (G) The average number of T cells per mm2 of lesions was determined by evaluating 5 representative spinal cord cross sections (1 cervical, 2 thoracal, 2 lumbar cross sections) per animal, using 5 animals (MBP- and MOG-specific T cells) or 4 animals (S100β-specific T cells) per group. Asterisks indicate statistically significant (p < 0,05) differences between individual CNS antigen specificities of the T cells used to induce CNS inflammation (Kruskal-Wallis followed by Mann–Whitney U test and Bonferroni-Holm correction; p = 0,0476 for MBP/S100β and S100β/MOG, p = 0.858 for MBP/MOG). (H) Numbers of ED1+ cells (activated microglia/macrophages) in spinal cord cross sections. The cell numbers were determined by evaluating one complete spinal cord cross section per animal, using 5 animals (MBP- and MOG-specific T cells) or 4 animals (S100β-specific T cells) per group. Asterisks indicate statistically significant (p < 0,05) differences between individual CNS antigen specificities of the T cells used to induce CNS inflammation (Kruskal-Wallis followed by Mann–Whitney U test and Bonferroni-Holm correction; p = 0,048 for MBP/S100β, p = 0,024 for MBP/MOG, and p = 0,189 for S100β/MOG).
Figure 6
Figure 6
Entry of human immunglobulins to lesions provoked by different CNS antigen-specific T cells in NMO-IgG seropositive animals. (A-F) T cells specific for MBP (A,B), S100β (C,D) and MOG (E,F) were used to induce CNS inflammation, followed by transfer of NMO-IgG 4 days after T cell transfer. The animals were sacrificed 5 days after T cell transfer. For histological evaluation, their spinal cords were reacted with anti-human IgG (brown reaction product) and counterstained with hematoxylin to reveal nuclei (blue). Overviews (A,C,E) and details (B,D,F) of representative spinal cord sections are shown. Bars = 100 μm.
Figure 7
Figure 7
Loss of AQP4 reactivity in NMO-like lesions initiated by T cells with different CNS antigen-specificities. (A-F) T cells specific for MBP (A,B), S100β (C,D) and MOG (E,F) were used to induce CNS inflammation, followed by transfer of NMO-IgG 4 days later. The animals were sacrificed 5 days after T cell transfer. For histological evaluation, their spinal cords were reacted with anti-AQP4 antibodies (brown reaction product) and counterstained with hematoxylin to reveal nuclei (blue). bars = 500 μm (A,C,E) and 100 μm (B,D,F). (G) The average number of lesions with AQP4 loss per spinal cord cross section, as determined by evaluating 5 representative spinal cord cross sections (1 cervical, 2 thoracal, and 2 lumbar cross sections) per animal, using 5 animals (MBP, MOG) and 4 animals (S100β) per group. Asterisks indicate statistically significant differences between individual CNS antigen specificities of the T cells used to induce CNS inflammation (ANOVA-Holm Sidak; p < 0,001 for MBP-specific T cells compared to MOG-specific T cells; p = 0,008 for MBP-specific T cells compared to S100β-specific T cells; and p = 0,005 for S100β-specific T cells compared to MOG-specific T cells). (H) The largest lesion with AQP4 loss per animal, using 5 animals (MBP, MOG) and 4 animals (S100β) per group. Asterisks indicate statistically significant differences between individual CNS antigen specificities of the T cells used to induce CNS inflammation (Mann–Whitney U test with Bonferroni-Holm correction; p = 0,732 for MBP/S100β, p = 0,024 for MBP/MOG, p = 0,048 for S100β/MOG).
Figure 8
Figure 8
Differences in T cell activation translate into differences in IFN-γ production, which affects the microglial expression of complement factors and complement inhibitors. (A) Normalized relative expression of IFN-γ mRNA in relation to the house-keeping gene beta actin (calculated using the following equation: 2-ΔCt = 2-[Ct(GOI)-Ct(HKG)] (GOI – Gene of interest; HKG – house-keeping gene; [19]) are shown. Statistically significant differences (*, as determined by one-way ANOVA followed by Bonferroni’s post-hoc testing) were observed between MBP-specific T cells and their MOG- or S100β-specific counterparts. (B) Pathways contributing to the complement cascade [20] and alterations in gene expression (encircled in red: upregulation; encircled in green: downregulation) of complement factors and inhibitors by IFN-γ treated microglia. (C-D) Changes in gene expression of complement factors and inhibitors (C) and of Fcgr3 (D) in IFN-γ treated microglia. These cells were treated for 48 hrs with 100 ng/ml IFN-γ. Subsequently, the mRNA of these cells was harvested and subjected to gene expression profiling. Log2-fold changes in gene expression and differences in the normalized signal intensities (nSI) of complement components/factors and Fcgr3 between IFN-γ and vehicle control-treated microglial cultures are shown (2 different, independent samples per treatment group). Genes with elevated expression in the IFN-γ treated group are labeled red, genes with lower expression levels are labeled green.

Similar articles

Cited by

References

    1. Fujihara K, Misu T, Nakashima I. et al.Neuromyelitis optica should be classified as an astrocytopathic disease rather than a demyelinating disease. Clin Exp Neuroimmunol. 2012;1:58–73. doi: 10.1111/j.1759-1961.2012.00030.x. - DOI
    1. Lennon VA, Kryzer TJ, Pittock SJ, Verkman AS, Hinson SR. IgG marker of optic-spinal multiple sclerosis binds to the aquaporin-4 water channel. J Exp Med. 2005;1:473–477. doi: 10.1084/jem.20050304. - DOI - PMC - PubMed
    1. Lennon VA, Wingerchuk DM, Kryzer TJ. et al.A serum autoantibody marker of neuromyelitis optica: distinction from multiple sclerosis. Lancet. 2004;1:2106–2112. doi: 10.1016/S0140-6736(04)17551-X. - DOI - PubMed
    1. Bennett JL, Lam C, Kalluri SR. et al.Intrathecal pathogenic anti-aquaporin-4 antibodies in early neuromyelitis optica. Ann Neurol. 2009;1:617–629. doi: 10.1002/ana.21802. - DOI - PMC - PubMed
    1. Bradl M, Misu T, Takahashi T. et al.Neuromyelitis optica: pathogenicity of patient immunoglobulin in vivo. Ann Neurol. 2009;1:630–643. doi: 10.1002/ana.21837. - DOI - PubMed

Publication types

MeSH terms