. 2014 Jan 15;5(1):173-84.
doi: 10.18632/oncotarget.1500.

Chloroquine synergizes with FTS to enhance cell growth inhibition and cell death

Affiliations

Chloroquine synergizes with FTS to enhance cell growth inhibition and cell death

Eran Schmukler et al. Oncotarget. .

Abstract

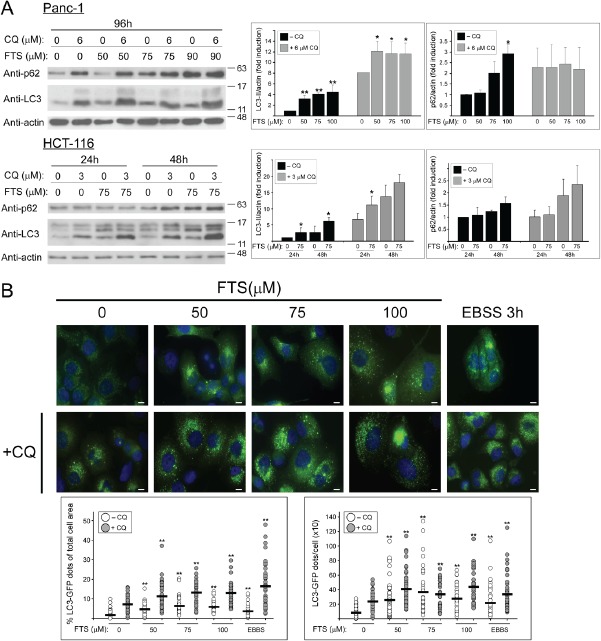
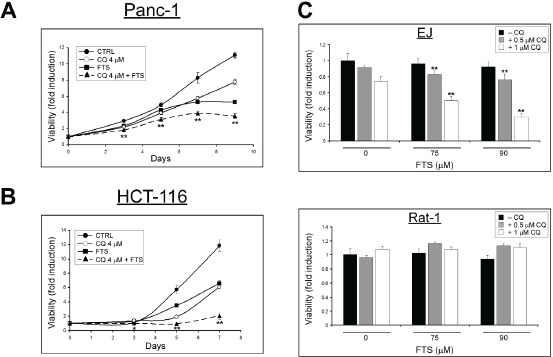
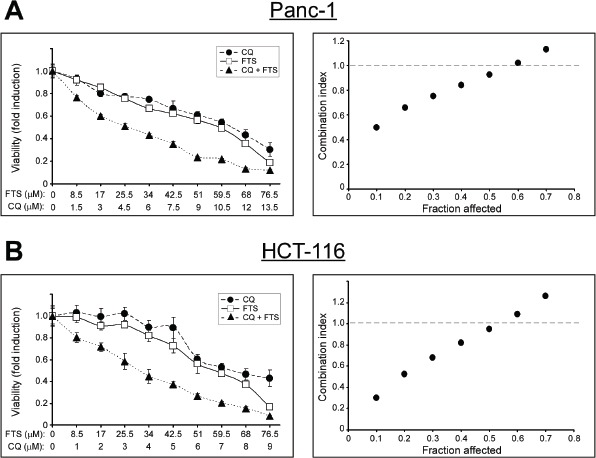
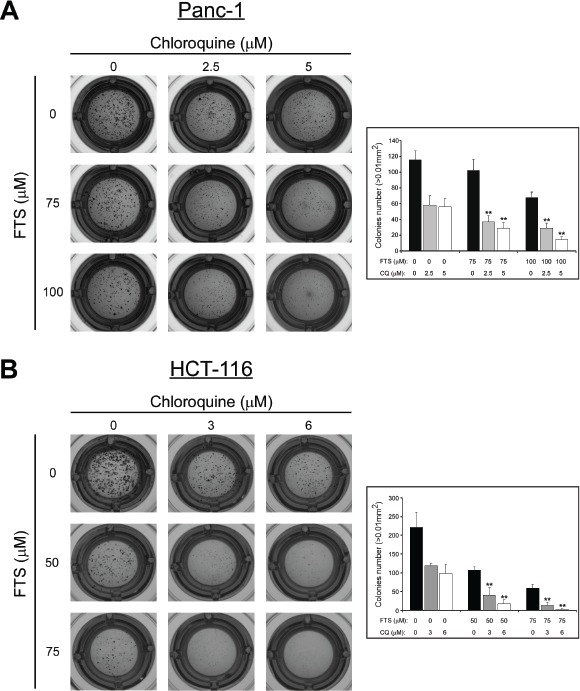
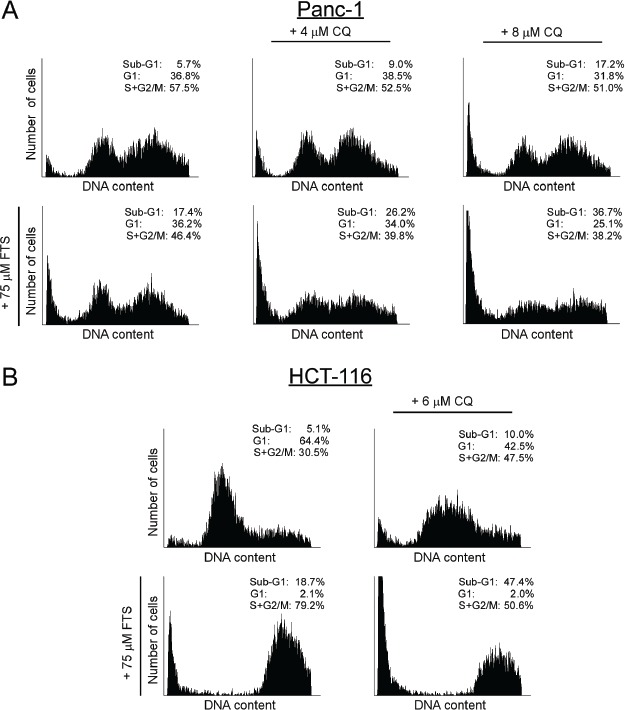
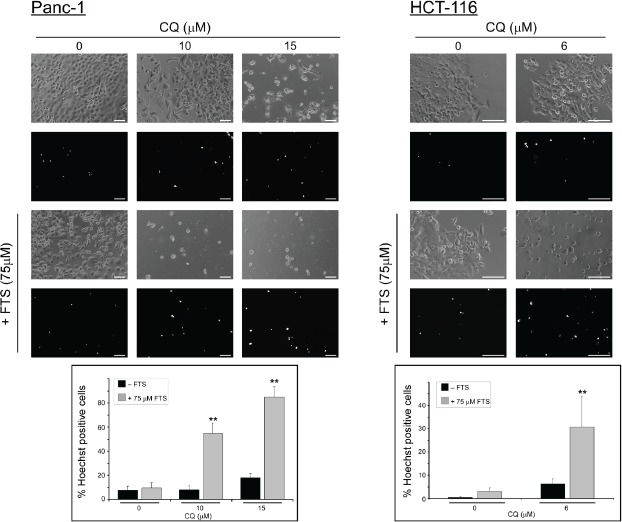
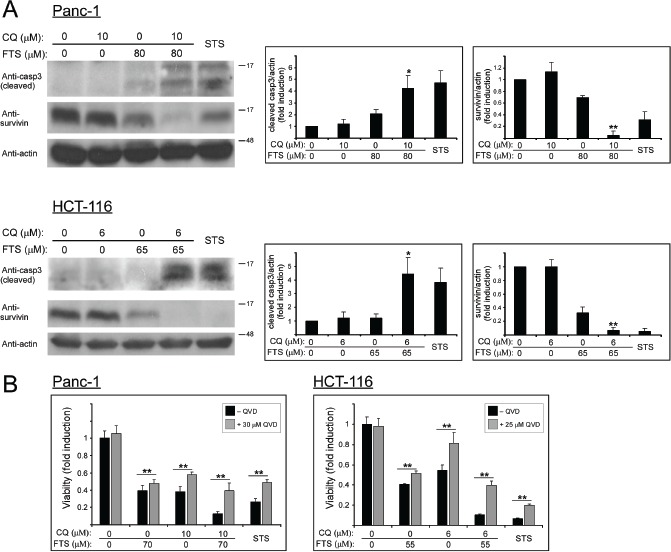
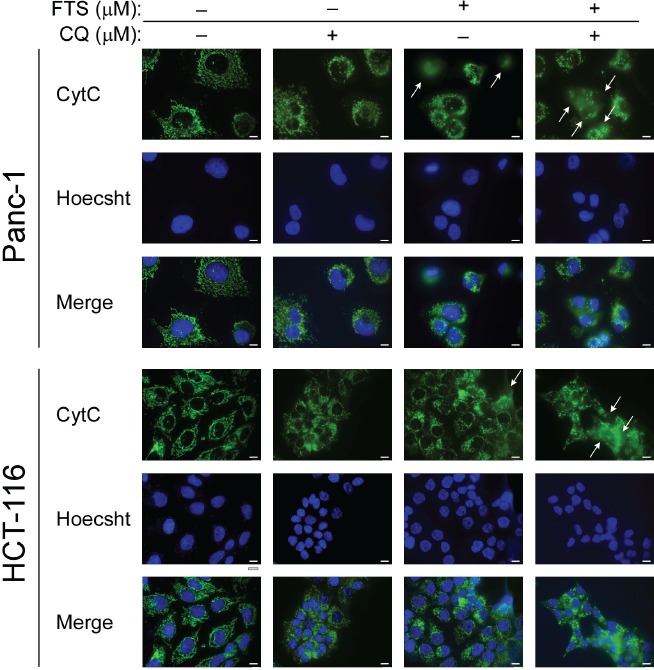
The Ras family of small GTPases transmits extracellular signals that regulate cell growth, differentiation, motility and death. Ras signaling is constitutively active in a large number of human cancers. Ras can also regulate autophagy by affecting several signaling pathways including the mTOR pathway. Autophagy is a process that regulates the balance between protein synthesis and protein degradation. It is important for normal growth control, but may be defective in diseases. Previously, we have shown that Ras inhibition by FTS induces autophagy, which partially protects cancer cells and may limit the use of FTS as an anti-cancer drug. Since FTS is a non toxic drug we hypothesized that FTS and chloroquine (an autophagy inhibitor) will synergize in cell growth inhibition and cell death. Thus, in the present study, we explored the mechanism of each individual drug and their combined action. Our results demonstrate that in HCT-116 and in Panc-1 cells, FTS induces autophagy, which can be inhibited by chloroquine. Furthermore, the combined treatment synergistically decreased the number of viable cells. Interestingly, the combined treatment enhanced apoptotic cell death as indicated by increased sub-G1 cell population, increased Hoechst staining, activation of caspase 3, decrease in survivin expression and release of cytochrome c. Thus, chloroquine treatment may promote FTS-mediated inhibition of tumor cell growth and may stimulate apoptotic cell death.


Figures

Figure 1
Figure 1. The effect of chloroquine and FTS treatments on autophagy
(A) Panc-1 and HCT-116 cells were treated with FTS at the indicated concentrations, with or without chloroquine (CQ, 3 and 6 µM) for the indicated times, and then subjected to immunoblot analysis using anti-LC3 and anti-p62 antibodies. Left panels, representative blots. Right panels, densitometric analysis of the results is presented as fold induction over the control untreated cells (means ± S.D, n=4; *, p < 0.05 and **, p<0.01). (B) Panc-1 cells stably expressing LC3-GFP were treated with or without 7.5 µM chloroquine in the absence or presence of FTS at the indicated concentrations, for 48 h. As a control, cells were incubated with EBSS for 3 h. The cells were fixed with 4% paraformaldehyde and nuclei were stained with bisdenzimide (Hoecsht 33258). Following fixation and staining, the cells were photographed using Olympus motorized inverted research microscope Model IX81 (60×magnifcation; scale bars, 10 micrometer). Upper panel, representative images are shown. Lower Panel, autophagy was quantified by calculating the percentage of LC3-GFP dots relative to the total cell area and by counting the number LC3 dots per cell using the ImageJ software. Each dot represents a single cell (horizontal black bar: average; 40-70 cells were analyzed per treatment; **, p < 0.01).
Figure 2
Figure 2. Chloroquine enhances FTS-induced cell growth inhibition
(A) Panc-1 and (B) HCT-116 cells were treated with 60 or 50 µM FTS respectively, with or without 4 µM chloroquine (CQ), for the indicated times. Cell viability was assessed at different time points using the methylene blue staining assay. (C) EJ and Rat-1 cells were treated for 4 days with FTS, with or without chloroquine for the indicated concentrations. The cells were then tested for cell viability using the methylene blue staining assay. Results are presented as fold induction over the control untreated cells, and are the mean ± S.D (n=6; *, p < 0.05 and **, p<0.01 compared to each treatment alone).
Figure 3
Figure 3. Analysis of the synergy between FTS and chloroquine
(A) Panc-1 and (B) HCT-116 cells were treated for 10 and 5 days, respectively, using increasing concentrations of FTS and chloroquine (CQ), either alone or at fixed ratio (5.67:1 for Panc-1 and 8.5:1 for HCT-116 cells). Left panels, cell viability was tested using the methylene blue staining assay. Results are presented as fold induction over the control untreated cells, and are the mean ± S.D (n=6). Right panels, the combination index was calculated as described in Materials and Methods and is plotted vs. affected fraction
Figure 4
Figure 4. Chloroquine enhances FTS-induced inhibition of anchorage-independent growth
(A) Panc-1 cells (2,700 cells/ well) and (B) HCT-116 cells (5,000 cells/well) were grown in soft agar for 13 or 11 days, respectively, in the presence of FTS, with or without chloroquine (CQ), at the indicated concentrations. Colonies were then stained as described in Materials and Methods. Left panels, photomicrographs of typical wells. Right panels, number of colonies (>0.01 mm2) is presented for each treatment as mean ± SD (n=6; **, p < 0.01 compared to each treatment alone).
Figure 5
Figure 5. Chloroquine enhances FTS-induced increase in sub-G1 population
(A) Panc-1 and (B) HCT-116 cells were treated with FTS, in the presence or absence of chloroquine (CQ) at the indicated concentrations, for 9 and 5 days, respectively. The cells were then harvested and analyzed for their DNA content by flow cytometry. The percentage of cells at various cell cycle stages is indicated.
Figure 6
Figure 6. Chloroquine enhances FTS-induced cell death
Panc-1 and HCT-116 cells were treated with 75 µM FTS, with or without chloroquine, at the indicated concentrations for 7 or 6 days, respectively. The cells were stained with the fluorescent DNA dye bisbenzimide (Hoechst 33258, 1 µg/ml) to assess the number of dying cells. Following staining, the cells were photographed using Olympus motorized inverted research microscope Model IX81 (20×magnifcation for HCT-116 cells and 10×magnifcation for Panc-1 cells ; scale bars, 100 micrometer). Upper panel, representative images. Lower panel, percentage of dying cells was estimated by counting the number of Hoechst-positive cells compared to the number of total cells in each field (7-10 fields for each treatment, 100-200 cells per field). Results are presented as mean ± S.D (**, p < 0.01, compared to each treatment alone).
Figure 7
Figure 7. Chloroquine enhances FTS-induced apoptosis
(A) Panc-1 and HCT-116 cells were treated with FTS with or without chloroquine at the indicated concentrations for 3 days, and then subjected to immunoblot analysis using anti-caspase 3 and anti-survivin antibodies. As positive control, cells were treated with staurosporine (STS) at 200 nM (Panc-1) and 150 nM (HCT-116). Left panels, representative blots. Right panels, densitometric analysis of the results is presented as fold induction over the control untreated cells (means ± S.D, n=3; *, p < 0.05 and **, p<0.01 compared to each treatment alone). (B) Panc-1 and HCT-116 cells were treated with FTS, chloroquine or both, with or without QVD-OPH at the indicated concentrations for 5 days. As positive control, cells were treated with staurosporine at 200 nM (Panc-1) and 150nM (HCT-116). Cell viability was assessed using the methylene blue staining assay. Results are presented as fold induction over the control untreated cells, and are the mean ± S.D (n=6; *, p < 0.05 and **, p<0.01).
Figure 8
Figure 8. Effect of FTS and chloroquine combination on cytochrome c release
Panc-1 and HCT-116 cells were treated with FTS (75 and 63 µM, respectively), with or without chloroquine (10 and 6 µM, respectively) for 48 h. The cells were fixed with 4% paraformaldehyde and immunostained with anti-cytochrome c (CytC) antibody followed by Alexa Fluor 488-labeled secondary antibody. Nuclei were stained with bisdenzimide (Hoecsht 33258). Following fixation and staining, the cells were photographed using Olympus motorized inverted research microscope Model IX81 (60×magnifcation; scale bars, 10 micrometer). Cells exhibiting evidence of cytochrome c release are indicated with arrows.

Similar articles

Cited by

References

    1. Vojtek AB, Der CJ. Increasing complexity of the Ras signaling pathway. The Journal of biological chemistry. 1998;273(32):19925–19928. - PubMed
    1. Downward J. Ras signalling and apoptosis. Current opinion in genetics & development. 1998;8(1):49–54. - PubMed
    1. Harris AL, Nicholson S, Sainsbury R, Wright C, Farndon J. Epidermal growth factor receptor and other oncogenes as prognostic markers. J Natl Cancer Inst Monogr. 1992;(11):181–187. - PubMed
    1. Reddy EP, Reynolds RK, Santos E, Barbacid M. A point mutation is responsible for the acquisition of transforming properties by the T24 human bladder carcinoma oncogene. Nature. 1982;300(5888):149–152. - PubMed
    1. Tabin CJ, Bradley SM, Bargmann CI, Weinberg RA, Papageorge AG, Scolnick EM, Dhar R, Lowy DR, Chang EH. Mechanism of activation of a human oncogene. Nature. 1982;300(5888):143–149. - PubMed

Publication types

MeSH terms