. 2013 Dec 24:2:e01287.
doi: 10.7554/eLife.01287.

Regulated aggregative multicellularity in a close unicellular relative of metazoa

Affiliations

Regulated aggregative multicellularity in a close unicellular relative of metazoa

Arnau Sebé-Pedrós et al. Elife. .

Abstract

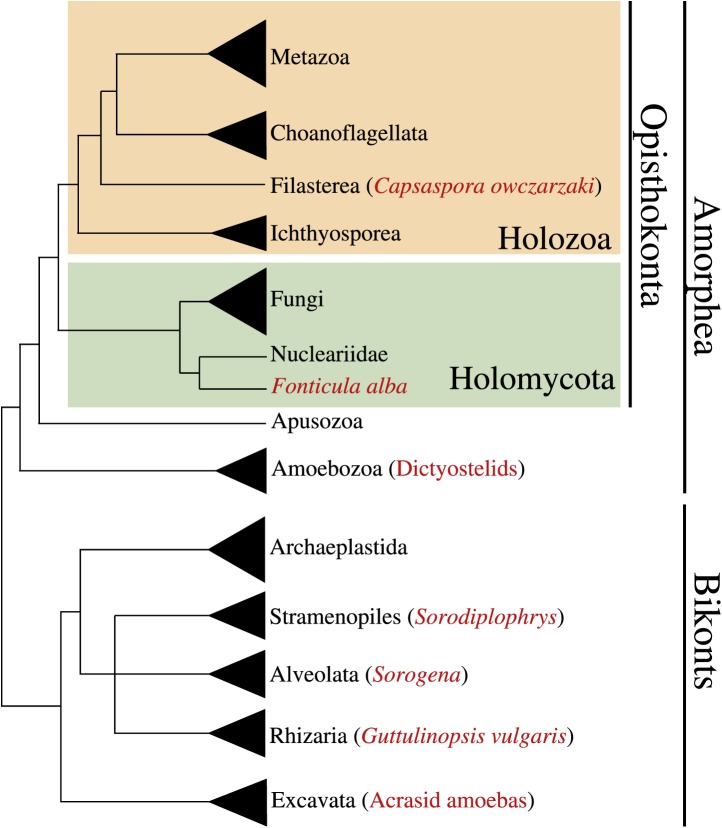
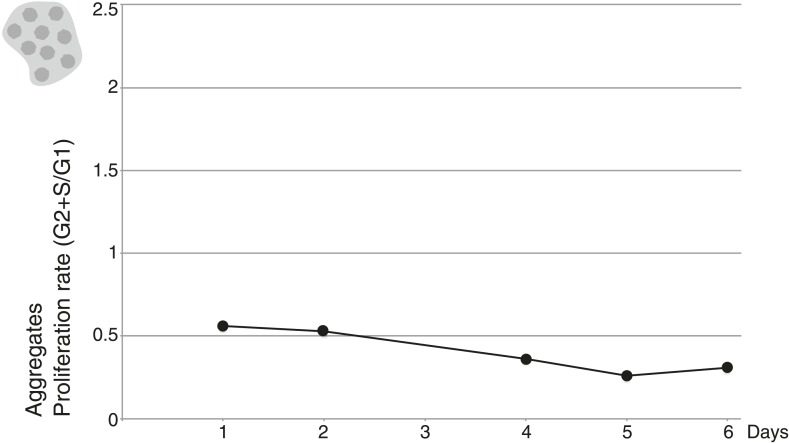
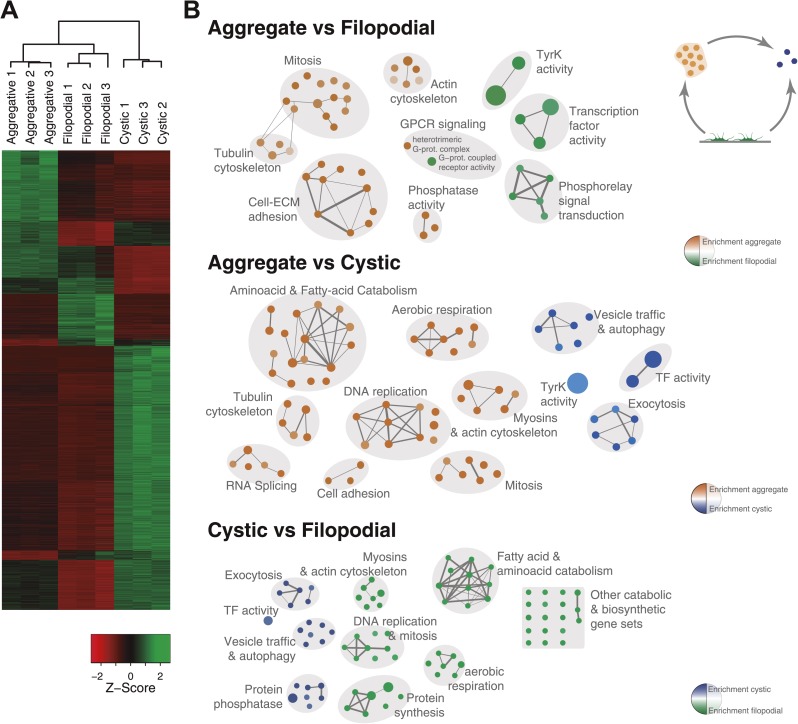
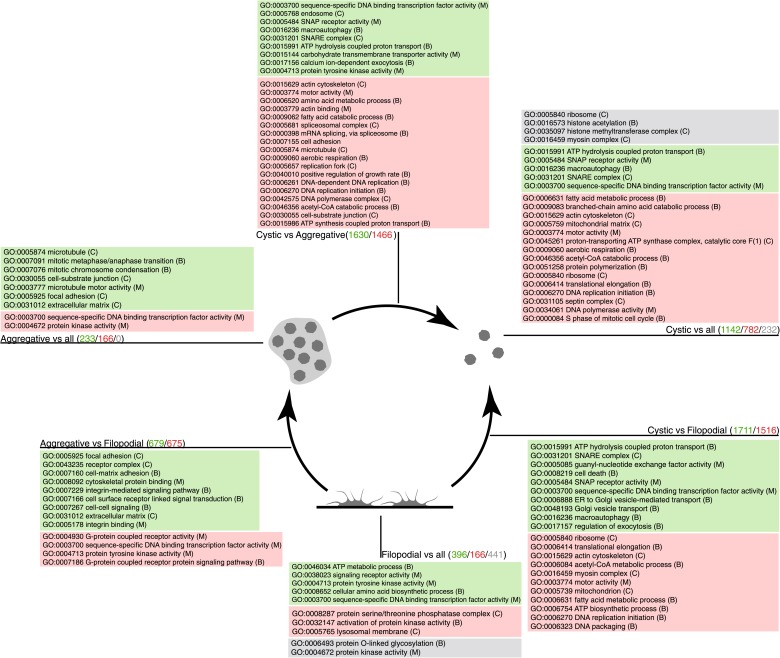
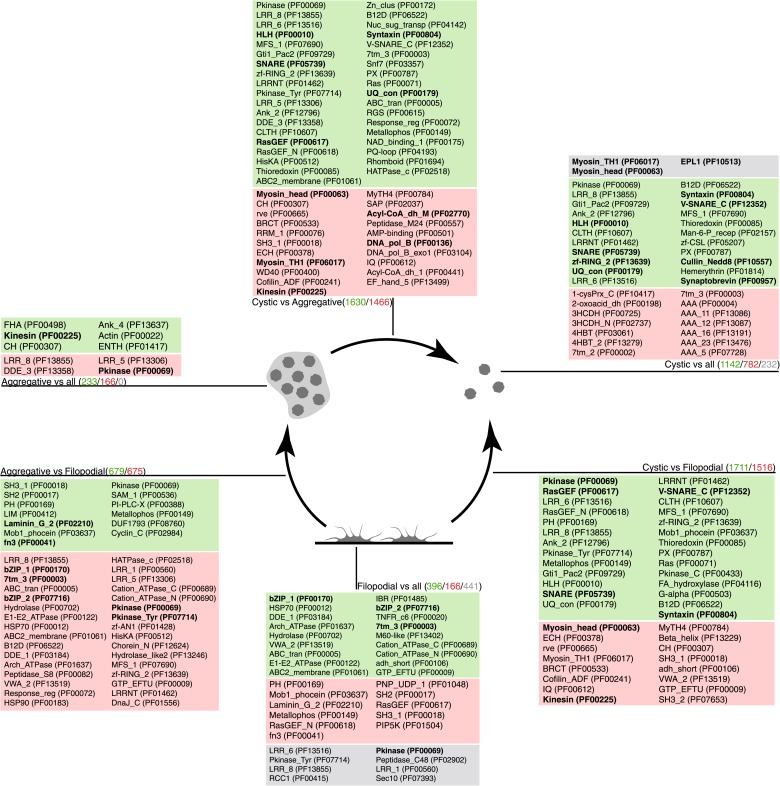
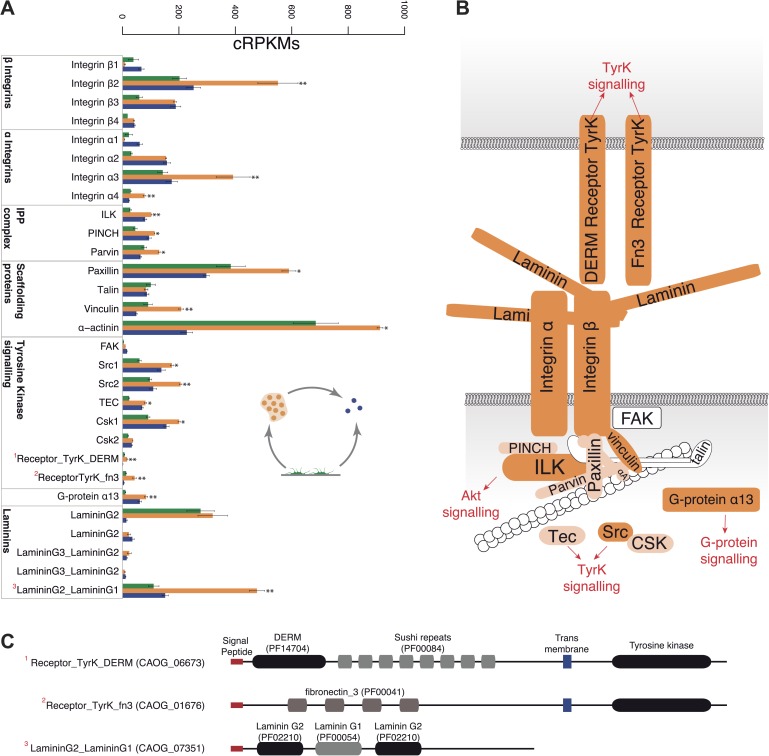
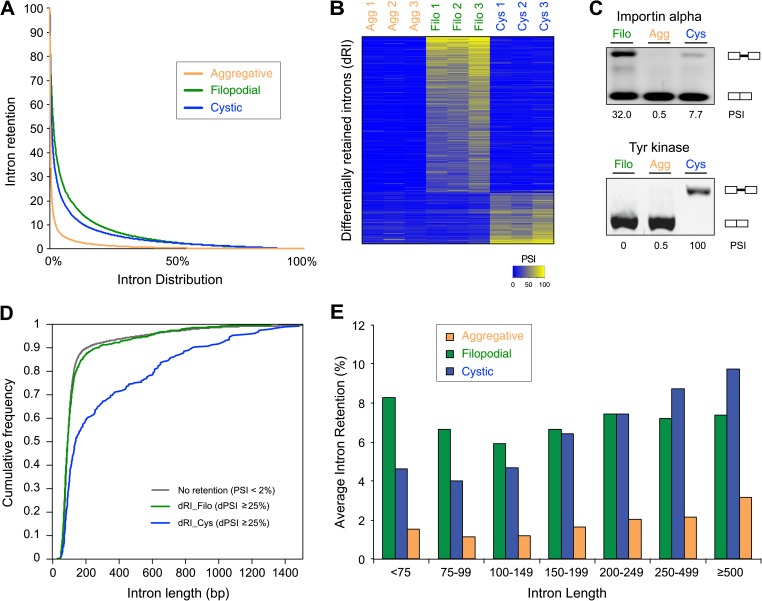
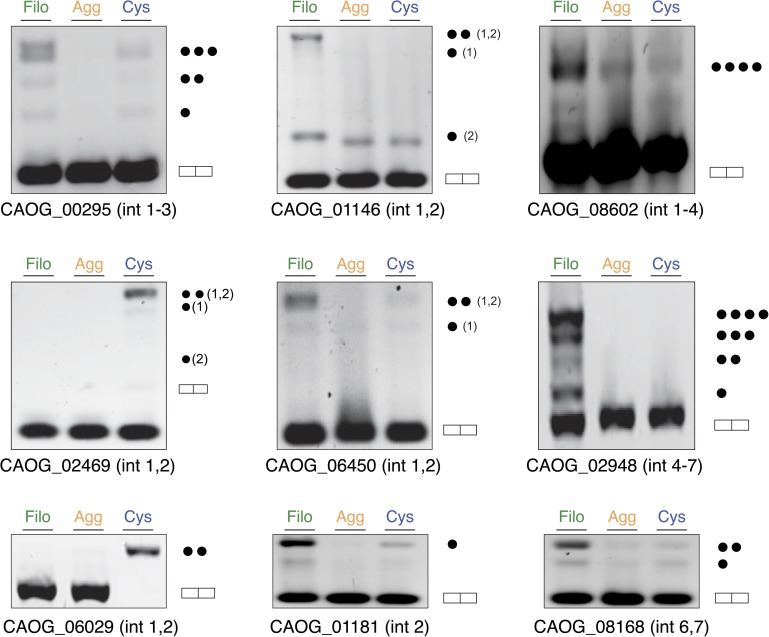
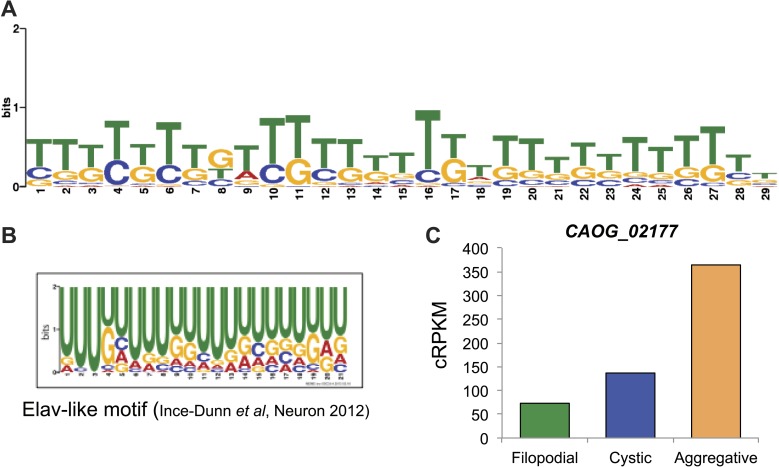
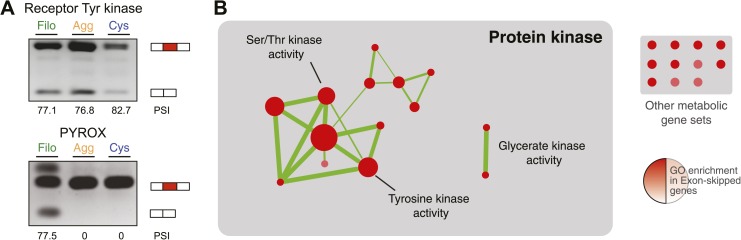
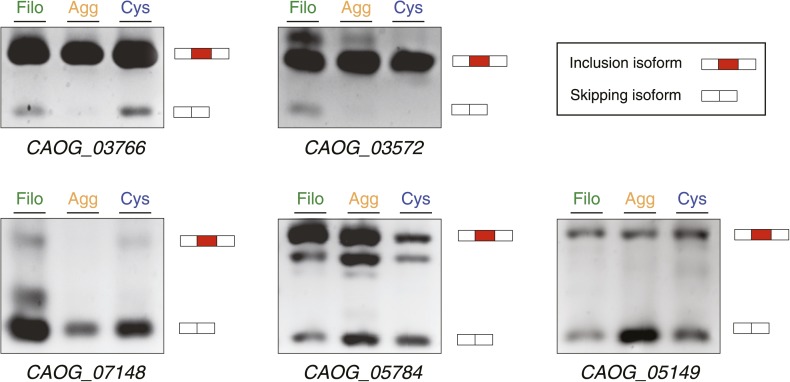
The evolution of metazoans from their unicellular ancestors was one of the most important events in the history of life. However, the cellular and genetic changes that ultimately led to the evolution of multicellularity are not known. In this study, we describe an aggregative multicellular stage in the protist Capsaspora owczarzaki, a close unicellular relative of metazoans. Remarkably, transition to the aggregative stage is associated with significant upregulation of orthologs of genes known to establish multicellularity and tissue architecture in metazoans. We further observe transitions in regulated alternative splicing during the C. owczarzaki life cycle, including the deployment of an exon network associated with signaling, a feature of splicing regulation so far only observed in metazoans. Our results reveal the existence of a highly regulated aggregative stage in C. owczarzaki and further suggest that features of aggregative behavior in an ancestral protist may had been co-opted to develop some multicellular properties currently seen in metazoans. DOI: http://dx.doi.org/10.7554/eLife.01287.001.

Keywords: Capsaspora; alternative splicing; cell differentiation; evolutionary transitions; opisthokonts.


Conflict of interest statement

BJB: Reviewing editor, eLife.

The other authors declare that no competing interests exist.

Figures

Figure 1.
Figure 1.. Phylogenetic position of Capsaspora owzarzaki within the eukaryotes.
The Holozoa clade (in yellow) includes Metazoa and their closest unicellular relatives: Choanoflagellata, Filasterea, and Ichthyosporea. C. owczarzaki represents one of the two known filastereans taxa that form the sister-group of choanoflagellates and metazoans. Other major eukaryotic groups are shown. Within each group, species or clades with aggregative multicellularity (see text) are highlighted in red. DOI: http://dx.doi.org/10.7554/eLife.01287.003
Figure 2.
Figure 2.. Flow-cytometry analysis of C. owzarzaki cell cycle.
(A) Total number of cells per day in each fraction (adherent and floating, see ‘Materials and methods’). (B) Proliferation rate per day. (C) Percentage of cells in S-phase per day and two examples of DNA-content profiles obtained from days 3 and 11. Note the reduction in the number of G2/M cells (second peak) and the drastic reduction in S-phase cells (the area between the two peaks). Data from adherent cells (‘Materials and methods’) is shown in green and data from floating cells in red. Experimental replicate 1 results are shown with solid lines and replicate 2 results with dashed lines. DOI: http://dx.doi.org/10.7554/eLife.01287.005
Figure 3.
Figure 3.. C. owzarzaki life cycle.
(A) Filopodial stage cells, amoebas with long filopodia. (B) Transition from filopodial to cystic stage: cells retract filopodia. (C) Cystic stage cells are rounded cysts without filopodia and slightly smaller than filopodial cells. (D) Transition from filopodial to aggregative stage: cells attach to each other and an extracellular matrix appears. (E) Mature aggregate. (F) Transmission EM showing adjacent cells in the aggregate separated by extracellular matrix. Arrows indicate the observed stage inter-conversions. Scale bars = 1 μm, except in panel D = 200 nm. DOI: http://dx.doi.org/10.7554/eLife.01287.006
Figure 4.
Figure 4.. C. owczarzaki cell clusters form by active aggregation, not clonal cell division.
Aggregation was induced in different stained cell populations (‘Materials and methods’). (A) Left, population of cells stained with Lysotracker (green), uniformly green aggregates are formed. Center, population of cells stained with Chormeo Mitochondrial Staining (cyan), uniformly cyan aggregates are formed. Right, two independently stained populations of cells (green or cyan) are mixed and dual color aggregates are formed, indicating that cells from different origins aggregate to each other. (B) Total number of cells per day in control cells, aphidicolin-treated cells and hydroxyurea-treated cells. Note that cell division is blocked by both aphidicolin and hydroxyurea. Aggregate formation was evaluated under each condition. All cells, even those treated with aphidicolin or hydroxyurea, developed aggregates. A representative aggregate is shown for each condition. Scale bars= 10 μm. DOI: http://dx.doi.org/10.7554/eLife.01287.009
Figure 4—figure supplement 1.
Figure 4—figure supplement 1.. Proliferation rate per day of aggregative cells.
DOI: http://dx.doi.org/10.7554/eLife.01287.010
Figure 5.
Figure 5.. Differential gene expression in C. owczarzaki.
(A) Heatmap showing differential gene expression in the different biological replicates of each stage. Only genes with cRPKM ≥ 5 in at least one sample and with a 2-fold expression change in at least one pair-wise comparison are shown. (B) Gene set enrichment analysis (GSEA) for the different cell stages (‘Materials and methods’). Orange represents enrichment in the aggregative stage, blue in the cystic stage, and green in the filopodial stage, with color intensity proportional to enrichment significance. The node size is proportional to the number of genes associated to the GO category, and the width of the edges is proportional to the number of genes shared between GO categories. Groups of functionally related GOs are manually circled and assigned a label. DOI: http://dx.doi.org/10.7554/eLife.01287.011
Figure 6.
Figure 6.. GO enrichment in sets of differentially expressed genes.
Pairwise (Aggregative vs Filopodial, Cystic vs Aggregative and Cystic vs Filopodial) and one-versus-all comparisons are indicated. The significantly overrepresented GO categories (‘Materials and methods’) are shown for sets of overexpressed (green) and downregulated (red) genes and for genes with differential intron retention (gray). The number of genes included in each set is indicated with the same color code. DOI: http://dx.doi.org/10.7554/eLife.01287.012
Figure 7.
Figure 7.. Pfam protein domain enrichment in sets of differentially expressed genes.
Pairwise (Aggregative vs Filopodial, Cystic vs Aggregative and Cystic vs Filopodial) and one-versus-all comparisons are indicated. Significantly overrepresented Pfam domains (‘Materials and methods’) are shown for sets of overexpressed (green) and downregulated (red) genes and for genes with differential intron retention (gray). The number of genes included in each set is indicated with the same color code. Those Pfam domains mentioned in the text are shown in bold. DOI: http://dx.doi.org/10.7554/eLife.01287.013
Figure 8.
Figure 8.. Expression of cell–ECM adhesion genes.
(A) Barplot of the expression values of each gene in the different stages, showing overexpression of most components in the aggregate stage (orange). Asterisks indicate that the gene is significantly differentially expressed in both (two asterisks) or only one (one asterisk) pair-wise comparison (agg. vs fil. and agg. vs cyst.). Bars show standard error. (B) Schematic representation of the putative C. owczarzaki integrin adhesome and putative associated signalling proteins, colored according to overexpression in aggregates as shown in the barplot (dark orange, two asterisks; light orange, one asterisk; and white, no differences in expression). (C) Specific protein domain architectures for the fibronectin and DERM receptor tyrosine kinases (CAOG_01676 and CAOG_06673) and for the laminin protein (CAOG_07351). DOI: http://dx.doi.org/10.7554/eLife.01287.014
Figure 9.
Figure 9.. Regulated alternative splicing in C. owzarzaki.
(A) Plot of percentage of intron inclusion by intron in rank order for the three studied cellular stages. Filopodial (green) and cystic (blue) stages show higher intron retention levels than the aggregative stage (orange) (p<2.2e-16, Wilcoxon Rank Sum test). (B) Heatmap of PSIs of filopodial- and cystic-specific differentially retained introns across three replicates for each cellular stage. (C) Examples of stage-specific intron retention. (D) Intron length distributions for differentially retained introns in cystic (blue), filopodial (green), and weakly retained introns (gray). (E) Relationship between intron length and retention. Percentage of average intron retention in each of the three cellular stages for different bins of intron size. In the cystic stage, the percentage of intron retention increased with intron length. DOI: http://dx.doi.org/10.7554/eLife.01287.015
Figure 9—figure supplement 1.
Figure 9—figure supplement 1.. Intron retention validation (see ‘Materials and methods’).
Genes with confirmed intron retention events are indicated using gene IDs. Each dot corresponds to the inclusion of one intron (introns in C. owczarzaki usually have very similar lengths, and thus different combinations of the same size introns cannot be differentiated). DOI: http://dx.doi.org/10.7554/eLife.01287.016
Figure 10.
Figure 10.. Possible role for an Elav-like ortholog in the negative regulation of filopodial stage-specific dRIs.
(A) Most significantly enriched motif in filopodial stage-specific dRIs, obtained by MEME. (B) Consensus motif obtained by CLIP-Seq data for an Elav-like member in mammals by Ince-Dunn et al. (2012) and that closely resembles the motif in (A). T∼U. (C) Expression (measured as cRPKMs) of CAOG_02177, a Elav-like ortholog from C. owczarzaki that shows lower expression in filopodial stage. DOI: http://dx.doi.org/10.7554/eLife.01287.017
Figure 11.
Figure 11.. Regulated exon-skipping in C. owzarzaki.
(A) Examples of exon skipping. (B) Gene set enrichment analysis (GSEA) of the genes containing cassette exons that are differentially-regulated among cellular stages showing high enrichment for protein kinase-associated activities. DOI: http://dx.doi.org/10.7554/eLife.01287.018
Figure 11—figure supplement 1.
Figure 11—figure supplement 1.. Exon Skipping validation by RT-PCR (‘Materials and methods’).
Note that DNA heteroduplexes between the two isoforms may be formed and appear as extra bands. Bars in the key correspond to the exons amplified: the alternative exon in red, and the adjoining constitutive exons in white. DOI: http://dx.doi.org/10.7554/eLife.01287.019

Comment in

References

    1. Abedin M, King N. 2008. The premetazoan ancestry of cadherins. Science 319:946–948. 10.1126/science.1151084 - DOI - PubMed
    1. Anders S, Huber W. 2010. Differential expression analysis for sequence count data. Genome Biology 11:R106. 10.1186/gb-2010-11-10-r106 - DOI - PMC - PubMed
    1. Arendt D. 2008. The evolution of cell types in animals: emerging principles from molecular studies. Nature Reviews Genetics 9:868–882. 10.1038/nrg2416 - DOI - PubMed
    1. Arendt D, Hausen H, Purschke G. 2009. The “division of labour”model of eye evolution. Philosophical Transactions of the Royal Society of London B Biological Sciences 364:2809. 10.1098/rstb.2009.0104 - DOI - PMC - PubMed
    1. Bailey TL, Boden M, Buske FA, Frith M, Grant CE, Clementi L, Ren J, Li WW, Noble WS. 2009. MEME Suite: tools for motif discovery and searching. Nucleic Acids Research 37:W202–W208. 10.1093/nar/gkp335 - DOI - PMC - PubMed

Publication types

LinkOut - more resources