. 2014 Mar 20;4(3):399-409.
doi: 10.1534/g3.113.009365.

The dynamics of diverse segmental amplifications in populations of Saccharomyces cerevisiae adapting to strong selection

Affiliations

The dynamics of diverse segmental amplifications in populations of Saccharomyces cerevisiae adapting to strong selection

Celia Payen et al. G3 (Bethesda). .

Abstract

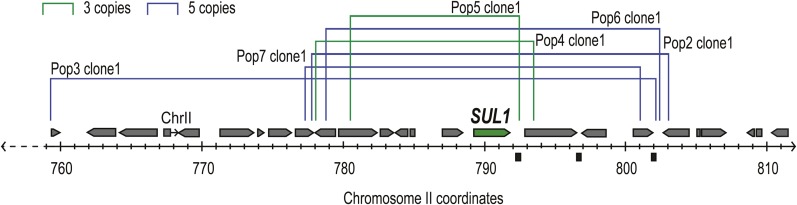
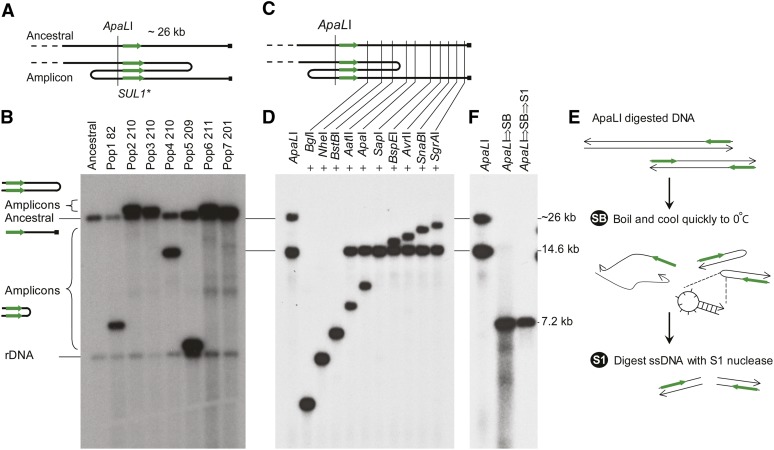
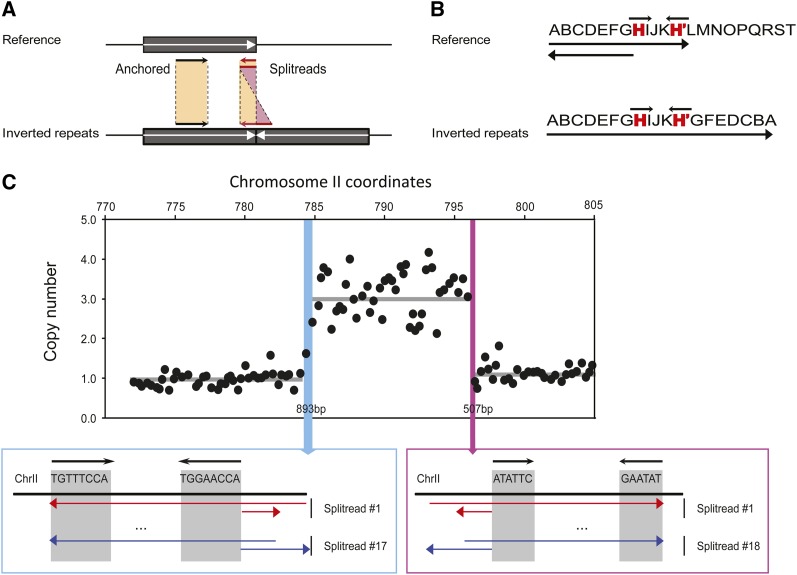
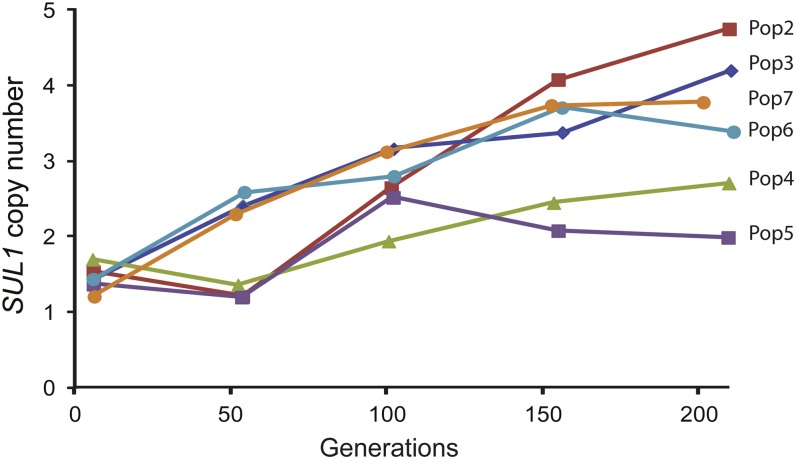
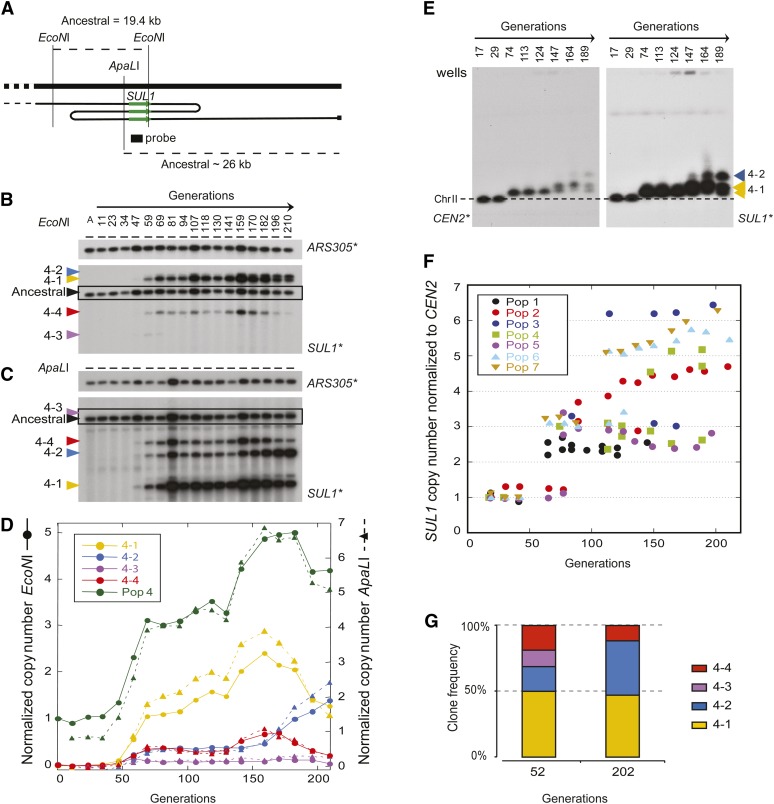
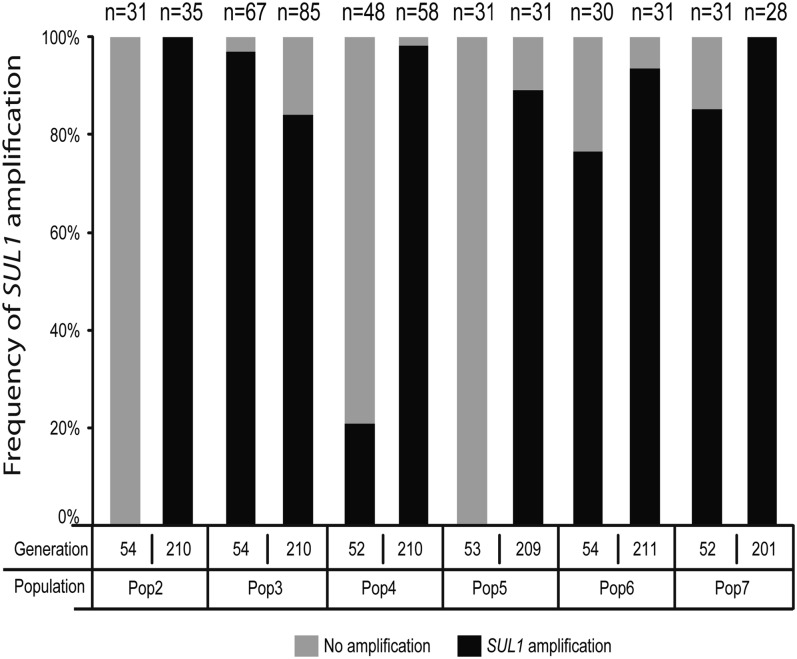
Population adaptation to strong selection can occur through the sequential or parallel accumulation of competing beneficial mutations. The dynamics, diversity, and rate of fixation of beneficial mutations within and between populations are still poorly understood. To study how the mutational landscape varies across populations during adaptation, we performed experimental evolution on seven parallel populations of Saccharomyces cerevisiae continuously cultured in limiting sulfate medium. By combining quantitative polymerase chain reaction, array comparative genomic hybridization, restriction digestion and contour-clamped homogeneous electric field gel electrophoresis, and whole-genome sequencing, we followed the trajectory of evolution to determine the identity and fate of beneficial mutations. During a period of 200 generations, the yeast populations displayed parallel evolutionary dynamics that were driven by the coexistence of independent beneficial mutations. Selective amplifications rapidly evolved under this selection pressure, in particular common inverted amplifications containing the sulfate transporter gene SUL1. Compared with single clones, detailed analysis of the populations uncovers a greater complexity whereby multiple subpopulations arise and compete despite a strong selection. The most common evolutionary adaptation to strong selection in these populations grown in sulfate limitation is determined by clonal interference, with adaptive variants both persisting and replacing one another.

Keywords: clonal interference; evolutionary genomics; experimental evolution; gene amplification; inverted triplication; whole genome sequencing.


Figures

Figure 1
Figure 1
Unique SUL1 amplicons are observed in clones isolated from six evolution experiments. The map illustrates the location of SUL1, flanking open reading frames, and the origin of replication, ARS228. The lines above the map show the extent of the amplified segment observed by aCGH (Figure S1) for each clone: blue line, copy number 5; green line, copy number 3.
Figure 2
Figure 2
Analysis of SUL1 amplicons reveals inverted structures. (A) Map of the right telomeric region of chromosome II shows the position of SUL1, the relevant restriction enzyme sites, the deduced structure of Pop4 gen201 clone1, and the probe (SUL1*) used for Southern blot analysis. (B) Southern blot of ApaLI digests of seven clones containing SUL1 amplifications isolated from independent evolution experiments and hybridized with the SUL1 probe. The ancestral fragment corresponds to the telomere-proximal SUL1 fragment. The more prominent bands of variable sizes correspond to fragments with novel chromosomal junctions. (C) Indirect end-labeling of ApaLI double digests. The order of the lanes corresponds to the order in which the sites for the second restriction enzymes are found between ApaLI and the telomere. (D) Southern blot of the double digests. The series of bands of increasing sizes in the Southern blot indicates that the portion of the genome from SUL1 to the telomere is intact. Fragments that contain the amplicon junction comigrate with the expected fragments only up to the position of the junction. Second enzymes whose sites lie distal to the amplicon junction fail to make a second cleavage and produce the amplicon-specific ApaLI junction fragment. (E) A schematic illustrating the snap-back (SB)/S1 nuclease assay (S1). The rapid chilling of denatured ApaLI fragments only permits reformation of dsDNA if the molecule is self-complementary. S1 treatment degrades all single stranded fragments including the ssDNA in the loop. (F) Southern analysis of the snap-back/S1-nuclease assay of population 4 clone1 using the SUL1 probe. The 14.6-kb amplicon-specific ApaLI fragment generates an S1-resistant duplex molecule approximately half of its original size while the single strands of the ancestral fragment are degraded by S1 nuclease.
Figure 3
Figure 3
Detection of unique junctions using split-read methods. (A) Schematic diagram for the mapping of paired-end sequences at the junction. In a pair of reads where only one read is mapped (anchored), the second unmapped read is split into two parts and mapped to the genome. (B) Diagram for the split-read at the junction that contains an interrupted inverted repeat (H). (C) Expanded view of the last 35 kb of chromosome II containing the amplification of the SUL1 locus for Pop4 210 clone 1. The blue and pink boxes correspond to the regions in which the junctions of the amplification have occurred. The accumulation of split-reads that include the short inverted repeats (black arrows) indicates the junctions of the rearrangements in the evolved genome.
Figure 4
Figure 4
Evolutionary dynamics of SUL1 amplification of experimental populations evolved in sulfate limitation medium. The copy number of SUL1 was assessed using qPCR analysis on samples taken from Populations 2 through 7 every ~50 generations.
Figure 5
Figure 5
Kinetics of SUL1 amplicon formation during ~200 generations of sulfate-limited growth. (A) A map of the SUL1 region of chromosome II showing the positions of ApaLI and EcoNI restriction sites used to digest DNA isolated from different samples of evolution #4 (Pop4). The location of SUL1, a hypothetical structure of an inverted amplicon, and the probe used for Southern hybridization are also shown. (B) EcoNI digestion and electrophoretic separation of chromosomal fragments recovered during sulfate limited growth. Top, control hybridization of the Southern blot with a single copy sequence ARS305. Bottom, hybridization of the EcoNI blot with SUL1. (C) ApaLI digestion and electrophoretic separation of the same DNA samples as in panel B. Top, hybridization of the blot with ARS305. Bottom, hybridization of the blot with SUL1. (D). Quantification of different amplicons during evolution #4 (Pop4) using ARS305 hybridization for normalization. A minimum of four unique amplicons were detected for both digests. Their pattern of abundance, appearance and disappearance identifies which proximal and distal junction fragments make up individual amplicons (for example, 4-2). (E) CHEF gel analysis of population samples of Pop4. The Southern blot was hybridized sequentially with a CEN2 probe (left) and then a SUL1 probe (right). (F) Determination of SUL1 copy number on variant copies of chromosome II. For each form of chromosome II that accounted for at least 20% of the chromosome IIs in the population, the ratio of SUL1/CEN2 was normalized to the ratio at the start of the evolution experiment to determine the copy number of SUL1 for each variant chromosome II. For several evolution experiments multiple different forms of chromosome II transiently coexisted. (G) Chart showing the proportion of clones from Pop4 detected by single clone analysis using ApaL1 digestion.
Figure 6
Figure 6
Frequency of SUL1 amplification at generations ~50 and ~200. qPCR was used to determine the percentage of clones with SUL1 amplification at generations ~50 and ~200 in six populations (in black) vs. percentage of clones found with only one copy of SUL1 (in gray).

References

    1. Adamo G. M., Lotti M., Tamás M. J., Brocca S., 2012. Amplification of the CUP1 gene is associated with evolution of copper tolerance in Saccharomyces cerevisiae. Microbiology 158: 2325–2335 - PubMed
    1. Andersson D. I., Slechta E. S., Roth J. R., 1998. Evidence that gene amplification underlies adaptive mutability of the bacterial lac operon. Science 282: 1133–1135 - PubMed
    1. Araya C. L., Payen C., Dunham M. J., Fields S., 2010. Whole-genome sequencing of a laboratory-evolved yeast strain. BMC Genomics 11: 88. - PMC - PubMed
    1. Barrick J. E., Yu D. S., Yoon S. H., Jeong H., Oh T. K., et al. , 2009. Genome evolution and adaptation in a long-term experiment with Escherichia coli. Nature 461: 1243–1247 - PubMed
    1. Blount Z. D., Barrick J. E., Davidson C. J., Lenski R. E., 2012. Genomic analysis of a key innovation in an experimental Escherichia coli population. Nature 489: 513–518 - PMC - PubMed

Publication types

MeSH terms

Associated data