. 2013 Dec 23;203(6):1043-61.
doi: 10.1083/jcb.201306019.

CLASP2 interacts with p120-catenin and governs microtubule dynamics at adherens junctions

Affiliations

CLASP2 interacts with p120-catenin and governs microtubule dynamics at adherens junctions

Marta N Shahbazi et al. J Cell Biol. .

Abstract

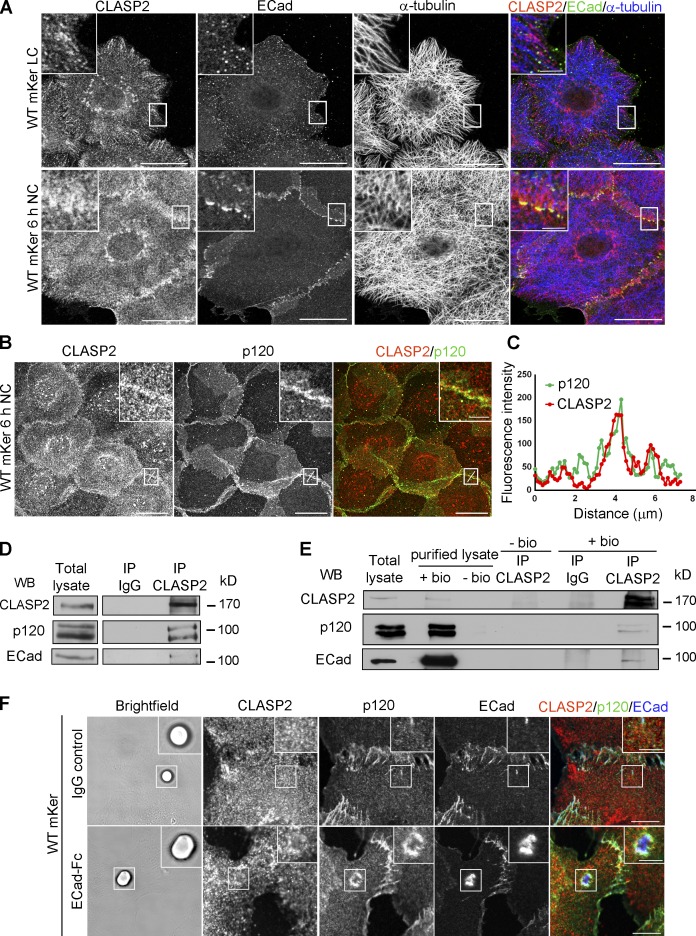
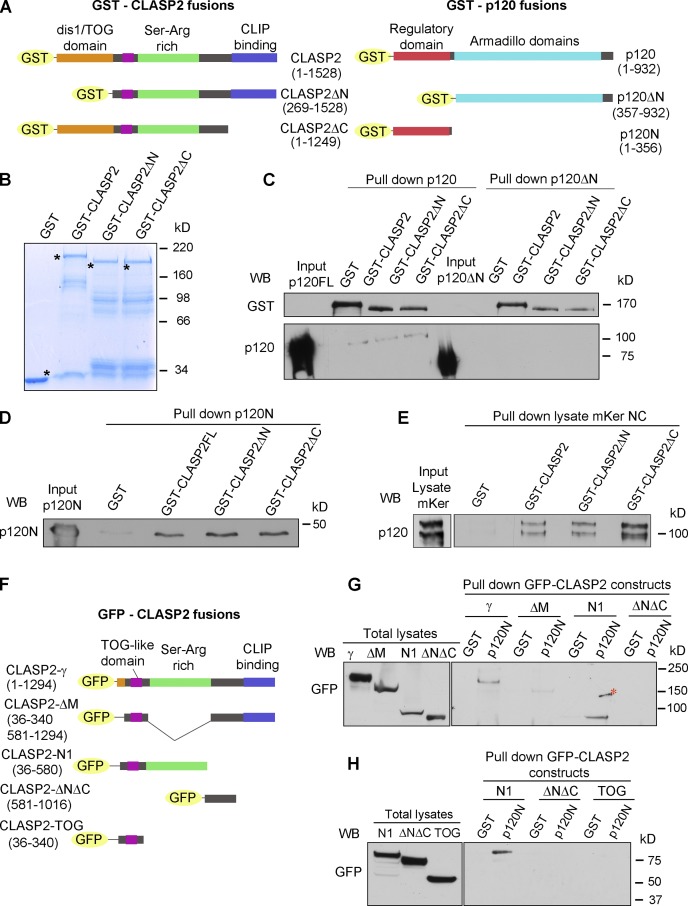
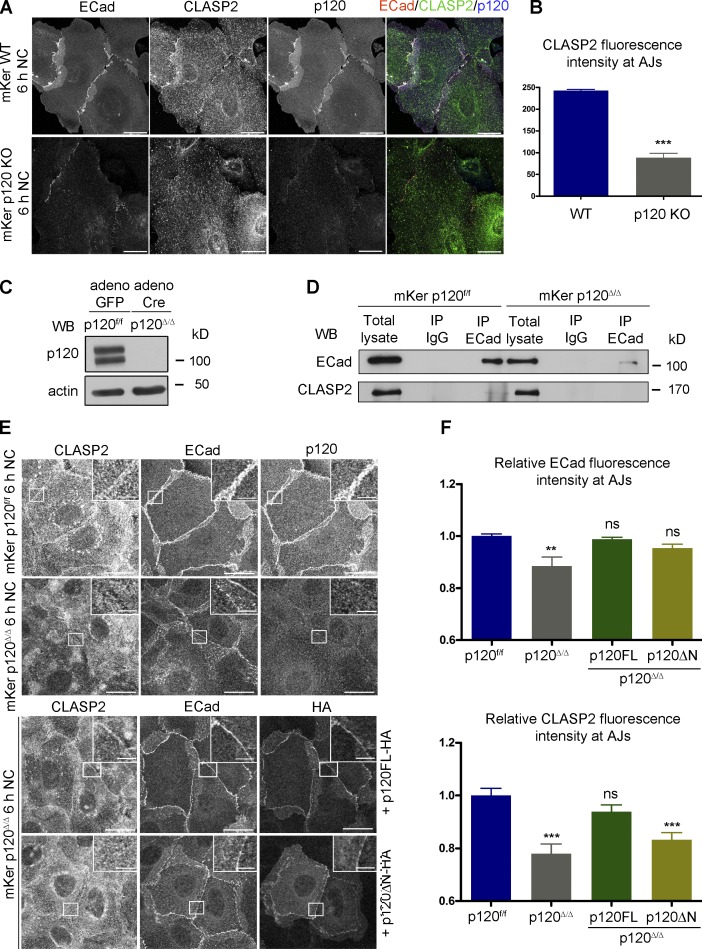
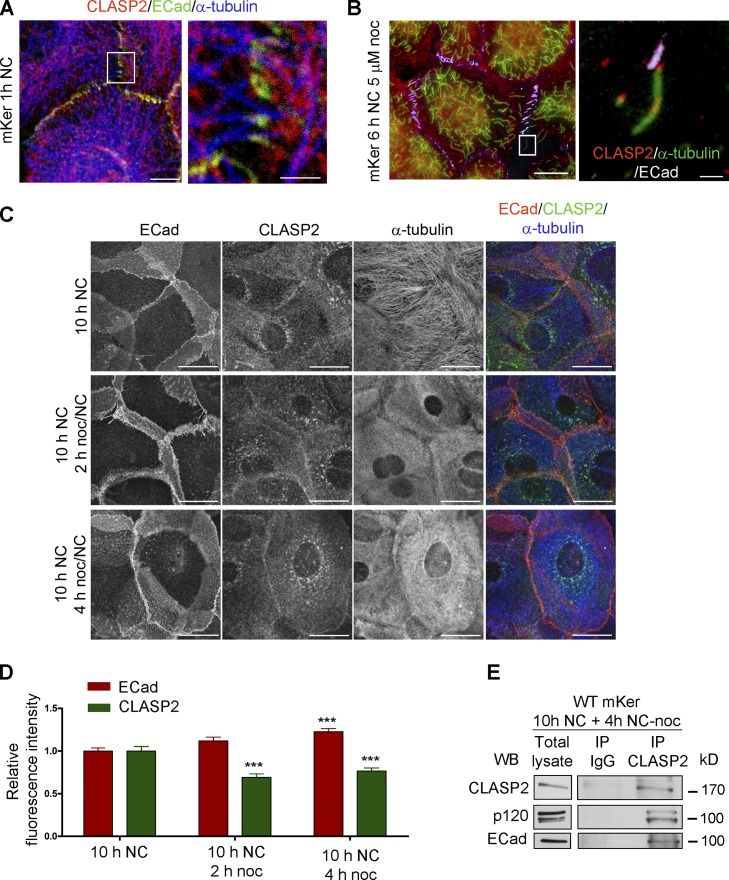
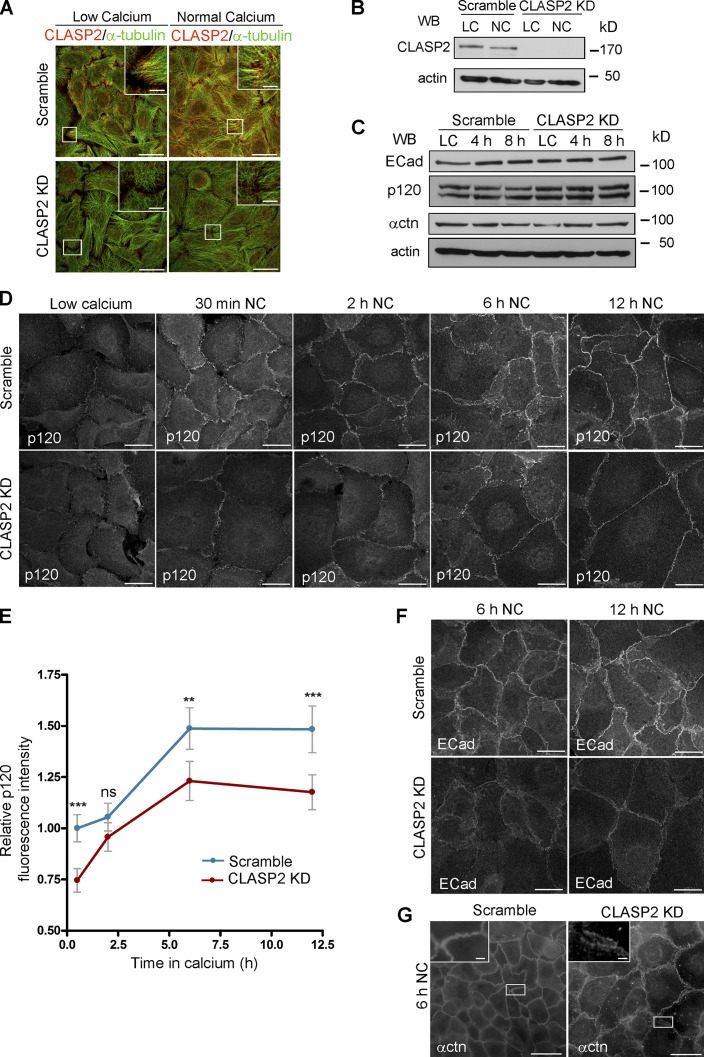
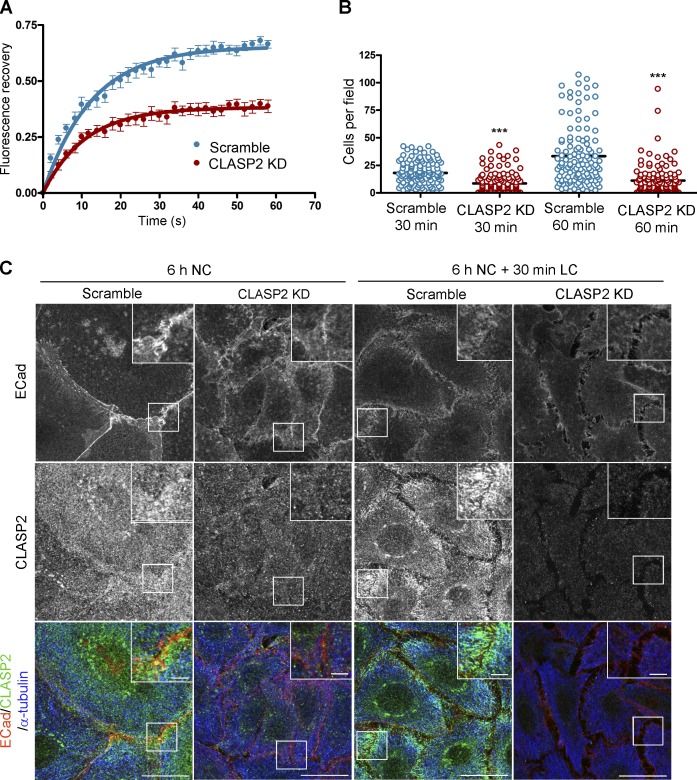
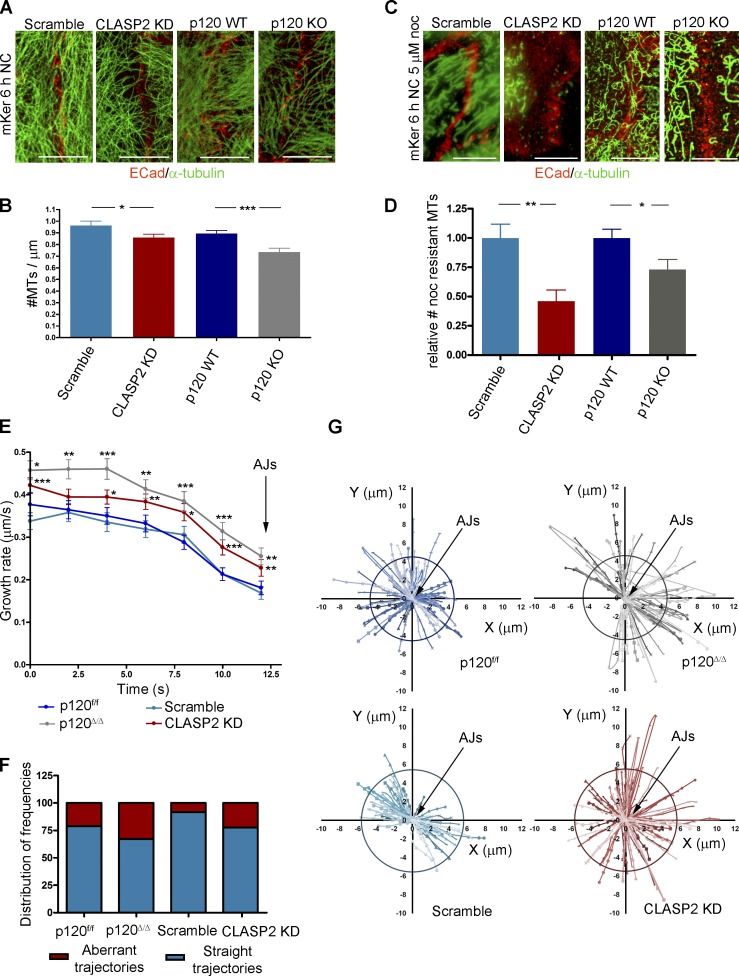
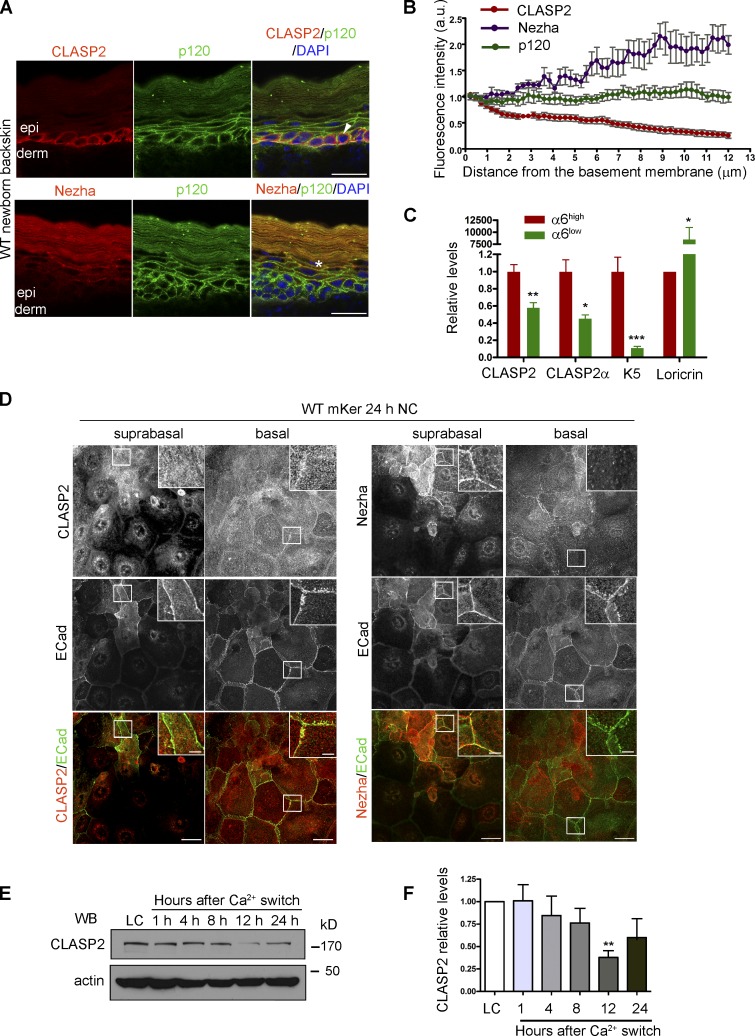
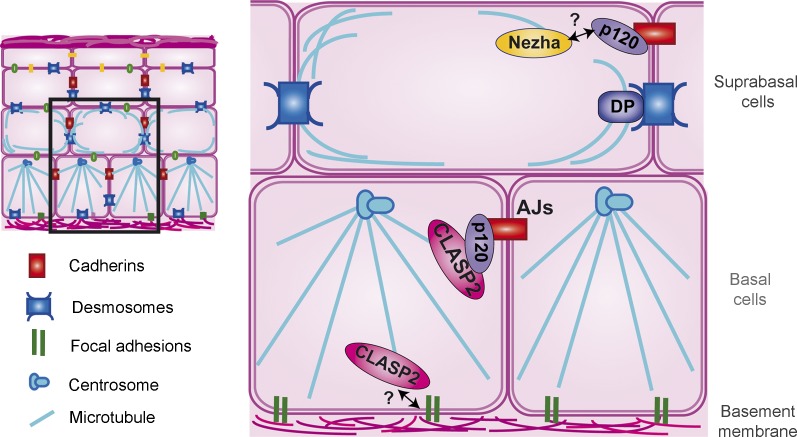
Classical cadherins and their connections with microtubules (MTs) are emerging as important determinants of cell adhesion. However, the functional relevance of such interactions and the molecular players that contribute to tissue architecture are still emerging. In this paper, we report that the MT plus end-binding protein CLASP2 localizes to adherens junctions (AJs) via direct interaction with p120-catenin (p120) in primary basal mouse keratinocytes. Reductions in the levels of p120 or CLASP2 decreased the localization of the other protein to cell-cell contacts and altered AJ dynamics and stability. These features were accompanied by decreased MT density and altered MT dynamics at intercellular junction sites. Interestingly, CLASP2 was enriched at the cortex of basal progenitor keratinocytes, in close localization to p120. Our findings suggest the existence of a new mechanism of MT targeting to AJs with potential functional implications in the maintenance of proper cell-cell adhesion in epidermal stem cells.


Figures

Figure 1.
Figure 1.
CLASP2 and p120 interact at AJs. (A) WT primary mKer were grown in low confluency to allow the formation of colonies. Cells were immunostained for CLASP2, ECad, and α-tubulin in the presence or absence of calcium (NC, normal calcium; LC, low calcium). (B) WT primary mKer immunostained for CLASP2 and p120 in the presence of calcium to induce formation of AJs. (C) Plot profile of CLASP2 and p120 fluorescence intensity at AJs in the area indicated in B. (D) CLASP2 was immunoprecipitated from mKer treated with calcium, and the immunoprecipitates (IP) were analyzed for CLASP2, ECad, and p120 by immunoblotting. Rabbit IgGs were used as a control. (E) Cell surface proteins from mKer treated with calcium were labeled with biotin (bio) and purified with a streptavidin column. CLASP2 was immunoprecipitated from the purified lysate of surface proteins, and CLASP2, p120, and ECad were analyzed by immunoblotting. Rabbit IgGs were used as a control of the immunoprecipitation, and a lysate of cells without biotin was used as a control of the purification. (F) WT mKer incubated with ECad-Fc–coated microspheres for 5 h in the presence of calcium. IgG-coated microspheres were used as a control. Cells were immunostained for CLASP2, p120, and ECad. Insets are magnifications of the boxed regions. WB, Western blot. Bars: (A and B, main images) 25 µm; (F) 10 µm; (A, B, and F, insets) 5 µm.
Figure 2.
Figure 2.
p120 and CLASP2 interact via the N-terminal domain of p120 and the Ser/Arg-rich region of CLASP2. (A) GST-tagged constructs of p120 and CLASP2 used for the in vitro pull-down assays. (B) SDS-PAGE gel showing the purified GST-CLASP2 recombinant proteins stained with Coomassie blue. Asterisks indicate bands of the expected molecular mass. (C) In vitro binding assay of GST-CLASP2 recombinant proteins with purified p120FL and p120ΔN (previously cleaved from GST with the PreScission Protease). (D) In vitro binding of GST-CLASP2 recombinant proteins with purified p120N. (E) Pull-down assay using the recombinant GST-CLASP2 proteins as bait for endogenous p120 present in lysates of mKer treated with calcium for 4 h. (E) GFP-tagged constructs of CLASP2. (F) Pull-down assays using GST-p120N recombinant protein and lysates of 293T cells expressing equal amounts of the GFP-tagged CLASP2 constructs of E. Pulled down proteins were immunoblotted for GFP. (H) Pull-down assay using GST-p120N recombinant protein and lysates of 293T cells expressing equal amounts of either GFP–CLASP2-N1 or GFP–CLASP2-ΔNΔC or GFP–CLASP2-TOG. WB, Western blot.
Figure 3.
Figure 3.
p120 is required for the recruitment of CLASP2 to AJs. (A) WT and p120 KO primary mKer immunostained for ECad, CLASP2, and p120 in the presence of calcium (NC). (B) Random individual plot profiles (n = 10 per cell/10 cells) were obtained from WT and p120 KO mKer. The fluorescence intensity level of CLASP2 corresponding to the maximum ECad intensity in each profile was quantified. Data are represented as means ± SEM; ***, P < 0.0001, Mann–Whitney U test. (C) Western blot (WB) showing the levels of p120 in primary mKer infected either with adeno-GFP (p120f/f) as a control or adeno-Cre-GFP (p120Δ/Δ). (D) ECad was immunoprecipitated from control p120f/f or from p120-null mKer (p120Δ/Δ). The immunoprecipitates (IP) were analyzed for ECad and CLASP2 by immunoblotting. (E) p120Δ/Δ mKer were transfected with either p120FL-HA or p120ΔN-HA and switched to a normal calcium media (NC) for 6 h. p120f/f and p120Δ/Δ mKer nontransfected were used as controls. Cells were immunostained for CLASP2, ECad, and HA. Insets are magnifications of the boxed regions. (F) Quantification of ECad and CLASP2 fluorescence intensity at AJs. Random individual plot profiles were generated at sites of cell–cell adhesion. The maximum value of ECad fluorescence intensity in the profile and its associated CLASP2 fluorescence intensity were quantified. Data were normalized to control values (p120f/f mKer) and represented as means ± SEM. **, P < 0.002, Mann–Whitney U test for ECad; ***, P < 0.0003, Student’s t test for CLASP2 (10 plot profiles per cell and 16 cells per condition). Bars: (A and E, main images) 25 µm; (E, insets) 5 µm.
Figure 4.
Figure 4.
CLASP2 is present at AJs either associated to MTs or in an MT-independent manner. (A) WT mKer were treated with calcium for 1 h and immunostained for CLASP2, ECad, and α-tubulin. The right image is a higher magnification of the selected region. (B) WT mKer were treated with calcium for 4 h followed by treatment with 5 µM nocodazole (noc) for 30 min and extraction of monomeric tubulin with saponin. Cells were immunostained for ECad, CLASP2, and α-tubulin. The right image is a higher magnification of the selected region. (C) WT primary mKer were treated with calcium (NC) for 10 h as a control followed by treatment with nocodazole + calcium for 2, 4, or 8 h. Cells were immunostained for ECad, CLASP2, and α-tubulin. (D) Random individual plot profiles at cell–cell adhesion sites (n = 10 per cell/40–50 cells) were obtained for the different time points of nocodazole treatment. The maximum fluorescence intensity of ECad and CLASP2 for each profile was quantified and normalized to the control not treated with nocodazole. Data are represented as means ± SEM. ***, P < 0.0001, Mann–Whitney U for ECad; ***, P < 0.001, Student’s t test for CLASP2. (E) CLASP2 was immunoprecipitated from mKer treated with calcium for 10 h followed by treatment with nocodazole + calcium for 4 h. The immunoprecipitates (IP) were analyzed for CLASP2, p120, and ECad by immunoblotting. WB, Western blot. Bars: (A, main image) 7.5 µm; (A, inset) 2 µm; (B, main image, and C) 25 µm; (B, inset) 5 µm.
Figure 5.
Figure 5.
CLASP2 is required for the proper formation of AJs. (A) WT mKer were infected with lentiviruses expressing either CLASP2 shRNA (CLASP2 knockdown [KD]) or scramble shRNA (scramble). The levels of CLASP2 were analyzed by immunofluorescence after selection with G418. (B) Western blot (WB) showing the levels of CLASP2 after infection with the corresponding lentiviruses. (C) Western blot showing the total levels of ECad, p120, and α-catenin (αctn) in scramble and CLASP2 knockdown mKer at different time points of a calcium-switch time course experiment. (D) Scramble and CLASP2-deficient mKer were subjected to calcium switch for 30 min, 2 h, 6 h, and 12 h and immunostained for p120. (E) Quantification of p120 levels at the membrane in scramble and CLASP2-deficient mKer. Random individual plot profiles were generated at sites of cell–cell adhesion (10 per cell, 25–35 cells), and the maximum fluorescence intensity was quantified. Data are normalized to scramble control values after 30 min of calcium treatment and represented as means ± SEM; **, P < 0.003; ***, P < 0.0001, Mann–Whitney U test. (F) Scramble and CLASP2-deficient mKer treated with calcium for either 6 or 12 h and immunostained for ECad. (G) Scramble and CLASP2-deficient mKer immunostained for α-catenin after 6-h calcium switch. Insets are magnifications of the boxed regions. Bars: (A, main images, D, and F) 25 µm; (G, main images) 50 µm; (A and G, insets) 5 µm.
Figure 6.
Figure 6.
CLASP2 is required to maintain the proper dynamics and functionality of AJs. (A) Graph showing the fluorescence recovery after photobleaching of p120-cherry in a ROI selected at an area of cell–cell contact, in both scramble and CLASP2 knockdown (KD) mKer. Dots represent arithmetic means ± SEM, and solid lines are best-fit single exponential curves. Data were normalized to prebleach and postbleach values. (B) CLASP2-deficient mKer and their WT counterparts (scramble) were allowed to attach to Fc-ECad–coated plates for 30 min and 1 h. After the removal of nonadhered cells, the number of cells attached to the plates was quantified in several fields (n = 3 independent experiments, 40 images per experiment). As negative controls, plates coated with mouse Fc and mKer in the presence of EDTA were used. Data are represented as means ± SEM; ***, P < 0.0001, Mann–Whitney U test. (C) CLASP2-deficient mKer and their WT counterparts (scramble) were treated for 6 h with calcium to induce AJ formation. Calcium was removed from the cell culture media to induce AJ disassembly, and 30 min after, cells were fixed and immunostained for ECad, CLASP2, and α-tubulin. Insets are magnifications of the boxed regions. Bars: (main images) 25 µm; (insets) 5 µm.
Figure 7.
Figure 7.
CLASP2 and p120 are required to maintain the proper dynamics of MTs at cell–cell contacts. (A) CLASP2-deficient and p120-null mKer with their corresponding scramble and p120f/f controls stained for ECad and α-tubulin. (B) Quantification of the number of MTs that reach an area of cell–cell contact. Only regions with well-formed AJs were selected for the analysis. (n = 60 cells, 2 independent experiments). Data are represented as means ± SEM; *, P < 0.04; ***, P < 0.0005, Student’s t test. (C) CLASP2-deficient and p120-null mKer with their corresponding controls (scramble and p120f/f) were grown with calcium for 4 h followed by addition of 5 µM nocodazole (noc) for 30 min and extraction of monomeric tubulin. Cells were stained for ECad and α-tubulin. (D) Quantification of the number of resistant MTs present at AJs after nocodazole treatment corresponding to C. Only regions with well-formed AJs were selected for the analysis (n = 30 cells, 2 independent experiments). Data are normalized to control values and represented as means ± SEM; *, P < 0.05; **, P < 0.002, Student’s t test. (E) EB3-GFP was expressed in scramble control cells, CLASP2-deficient cells (CLASP2 knockdown [KD]), p120 control cells (p120f/f), and p120-null cells (p120Δ/Δ). Time-lapse images were taken every 2 s. Individual EB3-GFP comets were manually tracked during the last 12 s before reaching an area of cell–cell contact. The speed in each frame is shown. (n = 10 cells; p120f/f: 58 MTs; p120Δ/Δ: 58 MTs; scramble: 59 MTs; CLASP2 knockdown: 74 MTs). Data are represented as means ± SEM; ***, P < 0.001; **, P < 0.01; *, P < 0.04, Student’s t test. (F) Frequency distribution of MTs showing aberrant trajectories or straight trajectories upon reaching an area of cell–cell contact from the experiment in E. (G) Individual trajectories of EB3-GFP comets in the xy plane were normalized to the last point of the trajectory (corresponding to the time in which EB3-GFP comets reach AJs and fall off the MT). Circles indicate the mean total distance covered by the p120f/f and scramble controls. Bars, 25 µm.
Figure 8.
Figure 8.
Differential distribution of CLASP2 and Nezha in the epidermis. (A) Back skins from WT newborn mice stained for CLASP2/p120 or Nezha/p120. The arrow denotes the basal distribution of CLASP2, and the asterisk indicates suprabasal Nezha localization. epi, epidermis; derm, dermis. (B) Quantification of CLASP2, Nezha, and p120 levels in the epidermis of newborn WT mice. Individual plot profiles were generated across the epidermis, and mean values of fluorescence intensity relative to those expressed at the basement membrane are shown. Data are represented as means ± SEM. (n = 3 mice, 30 plot profiles per mice per staining). a.u., arbitrary unit. (C) Real-time PCR analysis of mKer isolated from the back skin of newborn mice and FACS sorted according to their levels of α6 integrin into two populations: α6high (basal mKer) and α6low (suprabasal mKer). CLASP2 levels were analyzed with two different combinations of primers. Keratin 5 (K5) and loricrin were used as markers of basal and suprabasal mKer, respectively. For each primer pair, values were normalized to the transcript levels of the α6high population. Data are represented as means ± SEM; ***, P < 0.0004; **, P < 0.002; *, P < 0.03, Student’s t test. (D) WT mKer subjected to a 24-h calcium switch in vitro and immunostained for either CLASP2 or Nezha together with p120 and ECad. Insets are magnifications of the boxed regions. (E) Immunoblot analysis of CLASP2 levels in WT mKer subjected to a calcium-switch time course for the time points indicated in hours. LC, low calcium. (F) Quantification of CLASP2 levels observed by immunoblotting in D. n = 3 independent experiments. Data are normalized to LC values and represented as means ± SEM; *, P < 0.008, Student’s t test. Bars: (A and D, main images) 25 µm; (D, insets) 5 µm.
Figure 9.
Figure 9.
Proposed model for the p120–CLASP2 interaction at AJs in epidermal basal progenitors. A scheme of the stratified epidermis is shown, and the magnified area illustrates the microtubule connections with cell adhesions in basal and suprabasal layers. CLASP2 is enriched in basal progenitors, where it targets MTs plus ends to AJs via p120. Nezha localizes in the suprabasal differentiated layers of the epidermis, probably interacting with p120. DP, desmoplakin.

Comment in

Similar articles

Cited by

References

    1. Akhmanova A., Steinmetz M.O. 2008. Tracking the ends: a dynamic protein network controls the fate of microtubule tips. Nat. Rev. Mol. Cell Biol. 9:309–322 10.1038/nrm2369 - DOI - PubMed
    1. Akhmanova A., Hoogenraad C.C., Drabek K., Stepanova T., Dortland B., Verkerk T., Vermeulen W., Burgering B.M., De Zeeuw C.I., Grosveld F., Galjart N. 2001. Clasps are CLIP-115 and -170 associating proteins involved in the regional regulation of microtubule dynamics in motile fibroblasts. Cell. 104:923–935 10.1016/S0092-8674(01)00288-4 - DOI - PubMed
    1. Akhmanova A., Stehbens S.J., Yap A.S. 2009. Touch, grasp, deliver and control: functional cross-talk between microtubules and cell adhesions. Traffic. 10:268–274 10.1111/j.1600-0854.2008.00869.x - DOI - PubMed
    1. Bacallao R., Antony C., Dotti C., Karsenti E., Stelzer E.H., Simons K. 1989. The subcellular organization of Madin-Darby canine kidney cells during the formation of a polarized epithelium. J. Cell Biol. 109:2817–2832 10.1083/jcb.109.6.2817 - DOI - PMC - PubMed
    1. Bartolini F., Gundersen G.G. 2006. Generation of noncentrosomal microtubule arrays. J. Cell Sci. 119:4155–4163 10.1242/jcs.03227 - DOI - PubMed

Publication types

LinkOut - more resources