. 2013 Dec 10:4:919.
doi: 10.3389/fpsyg.2013.00919. eCollection 2013.

Tracking the allocation of attention using human pupillary oscillations

Affiliations

Tracking the allocation of attention using human pupillary oscillations

Marnix Naber et al. Front Psychol. .

Abstract

The muscles that control the pupil are richly innervated by the autonomic nervous system. While there are central pathways that drive pupil dilations in relation to arousal, there is no anatomical evidence that cortical centers involved with visual selective attention innervate the pupil. In this study, we show that such connections must exist. Specifically, we demonstrate a novel Pupil Frequency Tagging (PFT) method, where oscillatory changes in stimulus brightness over time are mirrored by pupil constrictions and dilations. We find that the luminance-induced pupil oscillations are enhanced when covert attention is directed to the flicker stimulus and when targets are correctly detected in an attentional tracking task. These results suggest that the amplitudes of pupil responses closely follow the allocation of focal visual attention and the encoding of stimuli. PFT provides a new opportunity to study top-down visual attention itself as well as identifying the pathways and mechanisms that support this unexpected phenomenon.

Keywords: PFT; SSVEP; attention; attentional blink; frequency tagging; oscillations; pupil; tracking.


Figures
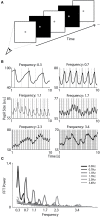
Figure 1
Figure 1
Pupillary responses to a range of screen flicker rates. (A) Observers viewed full monitor screens that flickered at a particular frequency rate (0.3, 0.7, 1.0, 1.7, 2.3, or 3.4 Hz) while their pupil size was recorded with a camera. (B) Examples of pupil size of a selected observer as a function of time in six separate trials with distinct flicker frequencies. The solid and dashed vertical lines indicate the onsets of white and black screens, respectively. (C) Average spectrum of FFT power per flicker frequency across all observers.
Figure 2
Figure 2
Pupillary assessment of spatial focal attention. (A) Procedure of Experiment 2. Observers fixated at the screen center and counted the number of times the attended object flipped upside down. Each quadrant had an object within a white rectangle that flickered off-and-on at a separate frequency (1.5, 1.75, 2.0, and 2.25 Hz). (B) Example of an observer's pupil size during a single trial (black). The four flickering stimuli induced continuous pupil oscillations. (C) Example of a single trial FFT power spectrum analysis of the pupil trace in (B). The four peaks at the presented frequency indicate that each quadrant left an oscillatory trace in the pupil. In this trial, the observer specifically attended an object that flickered at 1.75 Hz. This frequency was the strongest represented oscillation in the pupil trace. (D) FFT Power values for attended frequencies as a function of power averaged across the unattended frequencies. Each data point represents the average power for an individual observer at a particular target frequency (see colored markers). Attended frequencies reliably induced enhanced pupil oscillations amplitudes as compared to unattended frequencies across observers. (E) Average FFT power spectrum analysis across observers as a function of attended frequency (see colors). Attended frequencies induced significantly higher power values than unattended frequencies (*p < 0.05, ***p < 0.001).
Figure 3
Figure 3
Pupillary prediction of attentional resources and behavioral performance. (A) Procedure of Experiment 3 in which a flickering disk (2 Hz) with a superimposed letter stream circled around fixation. Observers had to detect the “x” while fixating at the center dot. The disk moved behind occluders at the vertical and horizontal meridians. The occluders had the same color as the background but are here indicated in a brighter gray for clarification. (B) Example of an observer's pupil size trace in a single trial. (C) FFT power analysis per observer (gray) and averaged across observers (black). (D) Power at 2 Hz as a function of time around hit (black) and missed targets (dashed gray). The transparent patches around the average indicate the standard error. The patch at the bottom of the plot indicates at which time points the power between hit and missed targets significantly differed (p < 0.05). (E) Average AUC as a function of time around target onset for FFT power distributions (black) and baseline raw pupil size (dashed gray). Patches at the bottom and top indicate significantly higher or lower AUC (compared to 0.5) for power values (black) or pupil baseline (gray).
Figure A1
Figure A1
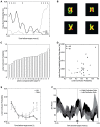
Image set used in Experiment 2. Objects were equal in size, luminance, and global contrast. Four images were randomly selected from this set per trial. Objects were collected from http://www.freeimages.co.uk/.
Figure A2
Figure A2
Average pupil oscillation power per quadrant location in Experiment 2. The flickering quadrant in the upper visual field induced the strongest pupillary responses.
Figure A3
Figure A3
Average difference in 2 Hz power between hits and misses as a function of time around target onset per size of the sliding window in the FFT power spectrum analysis.
Figure A4
Figure A4
False alarms, confusing letters, and misses. (A) Probability that an observer false alarmed to the onset of a non-target as a function of time before target onset per hits (black) and misses (gray). (*p < 0.05) (B) Examples of overlapping letters. Images were created by presenting each of the two letters in the separate red and green color channel such that the overlap in letters is indicated in yellow. (C) The probability to confuse a non-target letter with the letter “x” based on the amount of overlap in (B). (D) Letter onset probability before false alarm as a function of letter confusion probability per letter. The probabilities were based on the 4 preceding letters before the false alarm response (i.e., a one second window). (E) Letter confusion probability as a function of time before target onset per hits (black) and misses (gray). (F) Power at 2 Hz outputted by FFT analysis on pupil size around target onset per condition that the preceding 4 letters had an average high (black) or low (gray) confusion probability with the target letter “x”.

Comment in

References

    1. Alexandridis E., Manner M. (1977). Frequency of the pupillary response following flicker stimuli (author's transl). Albrecht Von Graefes Arch. Klin. Exp. Ophthalmol. 202, 175–180 - PubMed
    1. Andreassi J. L. (2000). Pupillary response and behavior, in Psychophysiology: Human Behavior and Physiological Response, ed Andreassi J. L. (Mahwah, NJ: Lawrence Erlbaum Assoc; ), 218–233
    1. Averbach E., Coriell A. (1961). Short-term memory in vision. Bell Sys. Tech. J. 40, 309–328 10.1002/j.1538-7305.1961.tb03987.x - DOI
    1. Barbur J. L., Harlow A. J., Sahraie A. (1992). Pupillary responses to stimulus structure, colour and movement. Ophthalmic Physiol. Opt. 12, 137–141 10.1111/j.1475-1313.1992.tb00276.x - DOI - PubMed
    1. Barbur J. L., Wolf J., Lennie P. (1998). Visual processing levels revealed by response latencies to changes in different visual attributes. Proc. Biol. Sci. 265, 2321–2325 10.1098/rspb.1998.0578 - DOI - PMC - PubMed