. 2014 Feb;137(Pt 2):335-53.
doi: 10.1093/brain/awt343. Epub 2013 Dec 24.

Efficient mitochondrial biogenesis drives incomplete penetrance in Leber's hereditary optic neuropathy

Affiliations

Efficient mitochondrial biogenesis drives incomplete penetrance in Leber's hereditary optic neuropathy

Carla Giordano et al. Brain. 2014 Feb.

Abstract

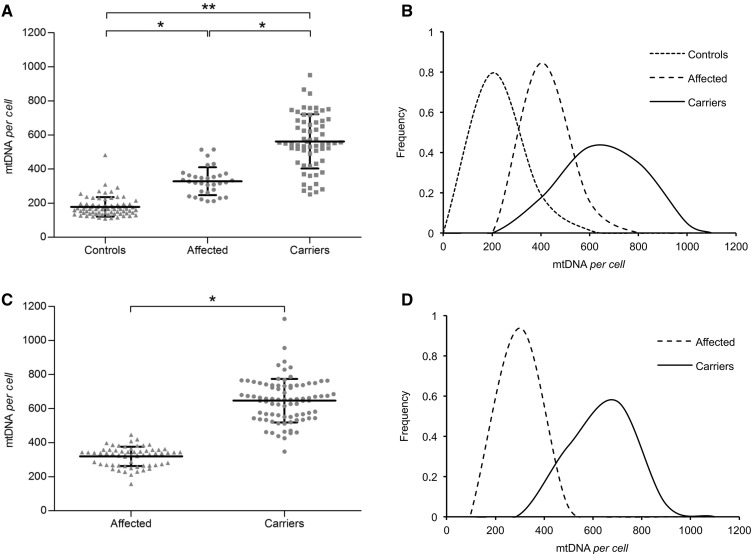
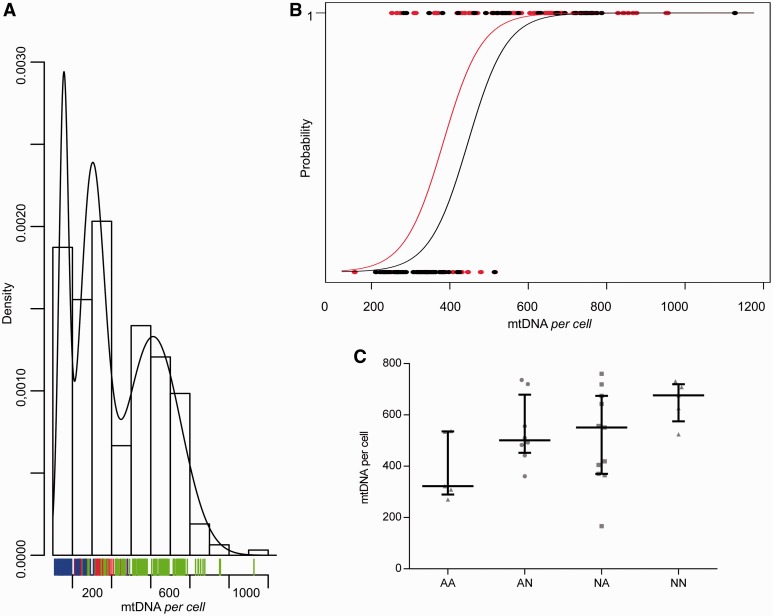
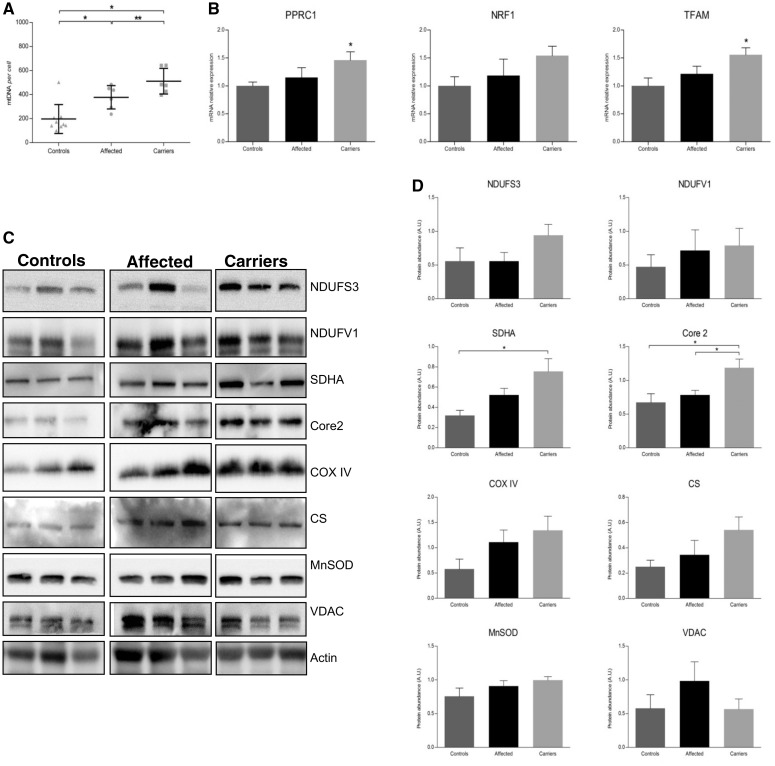
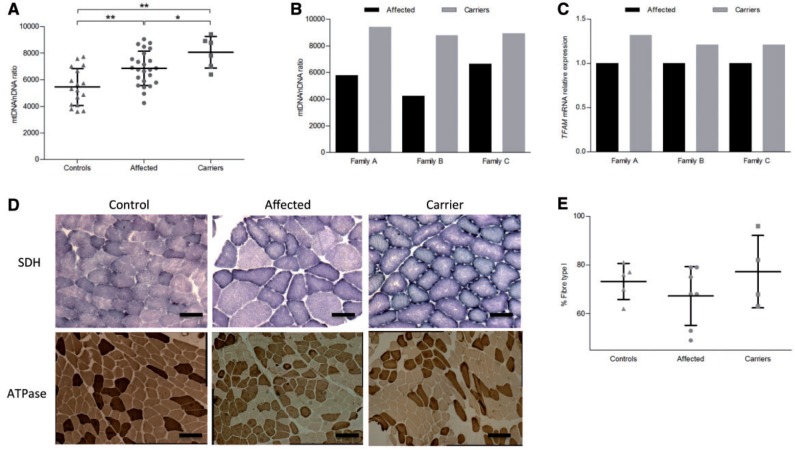
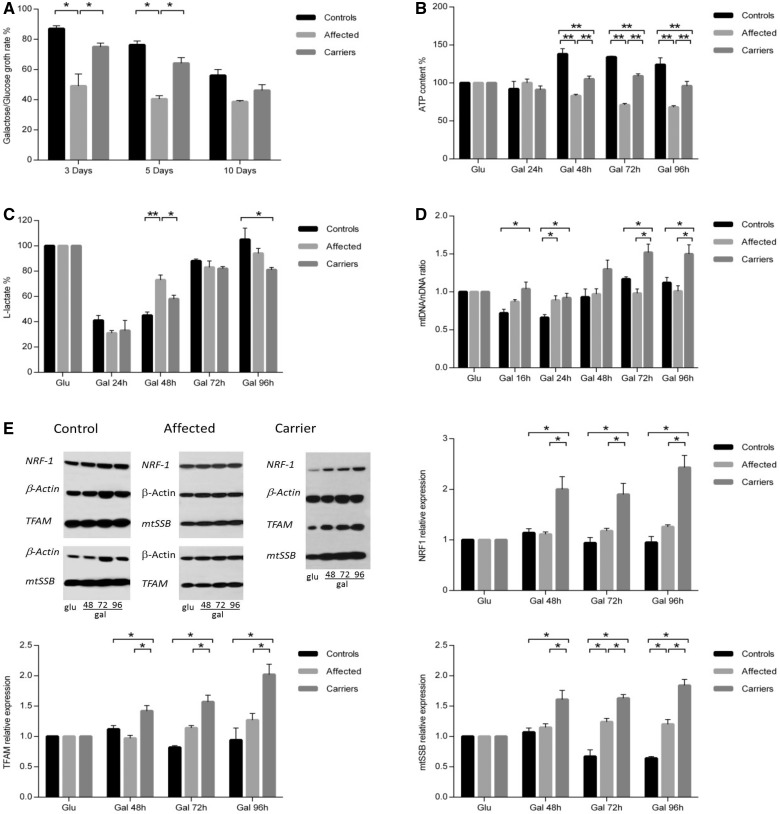
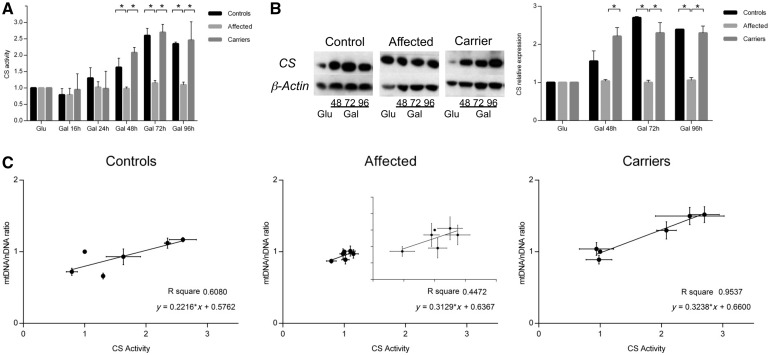
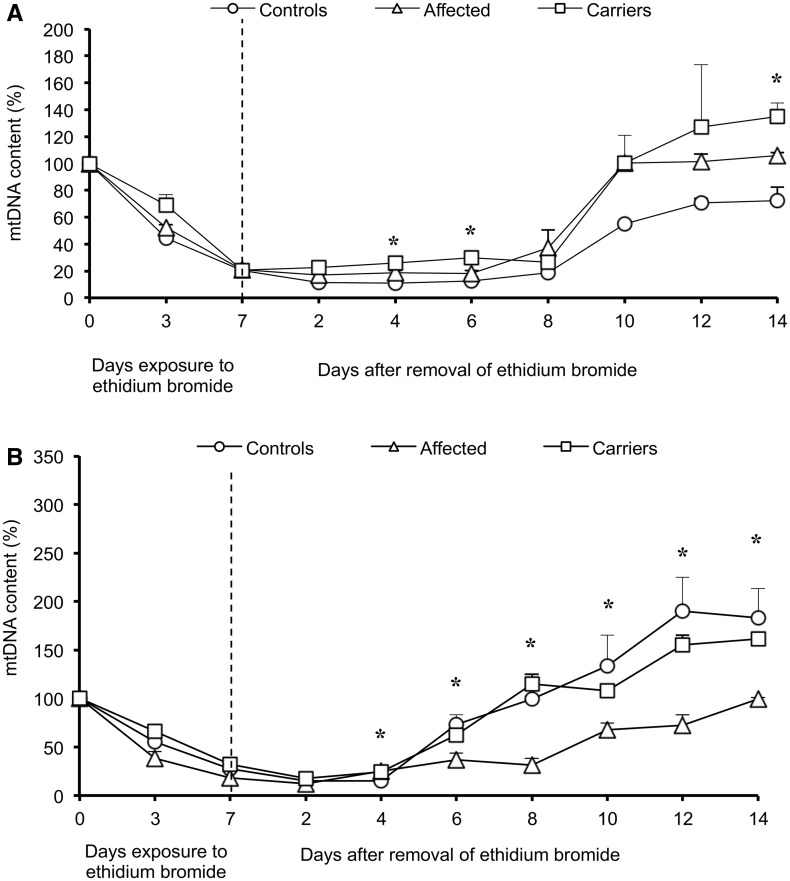
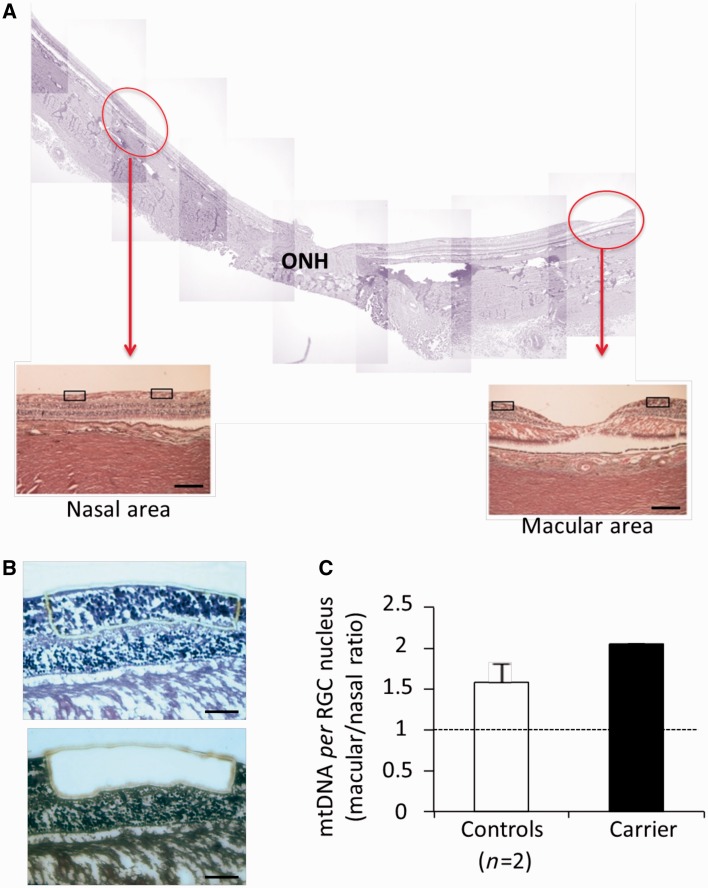
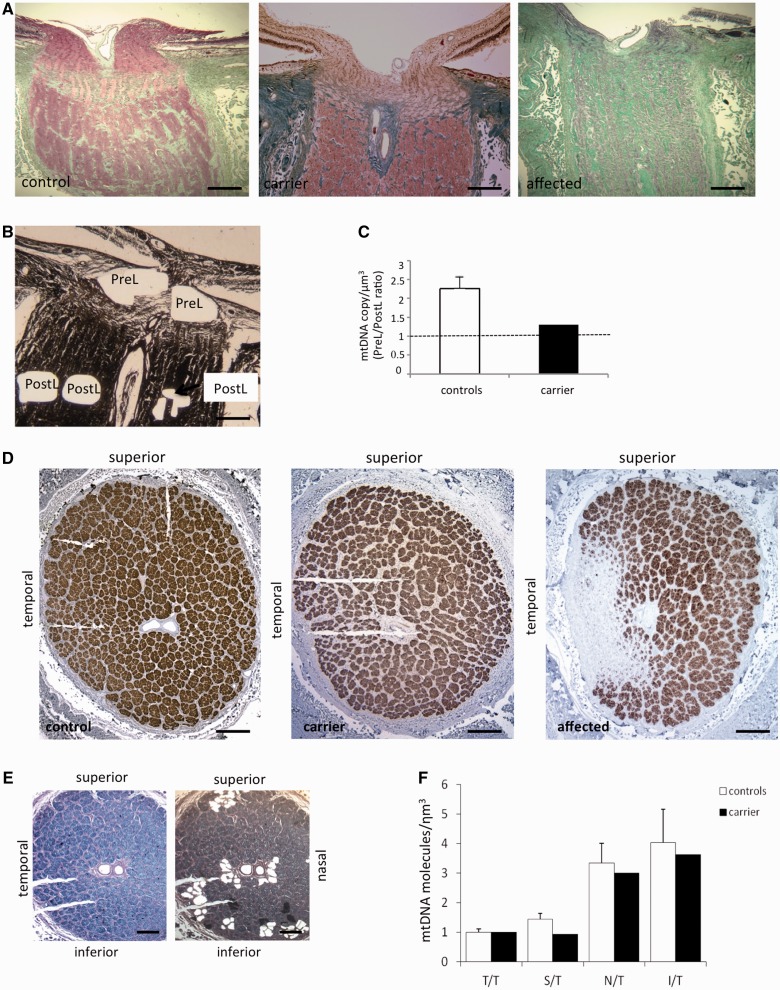
Leber's hereditary optic neuropathy is a maternally inherited blinding disease caused as a result of homoplasmic point mutations in complex I subunit genes of mitochondrial DNA. It is characterized by incomplete penetrance, as only some mutation carriers become affected. Thus, the mitochondrial DNA mutation is necessary but not sufficient to cause optic neuropathy. Environmental triggers and genetic modifying factors have been considered to explain its variable penetrance. We measured the mitochondrial DNA copy number and mitochondrial mass indicators in blood cells from affected and carrier individuals, screening three large pedigrees and 39 independently collected smaller families with Leber's hereditary optic neuropathy, as well as muscle biopsies and cells isolated by laser capturing from post-mortem specimens of retina and optic nerves, the latter being the disease targets. We show that unaffected mutation carriers have a significantly higher mitochondrial DNA copy number and mitochondrial mass compared with their affected relatives and control individuals. Comparative studies of fibroblasts from affected, carriers and controls, under different paradigms of metabolic demand, show that carriers display the highest capacity for activating mitochondrial biogenesis. Therefore we postulate that the increased mitochondrial biogenesis in carriers may overcome some of the pathogenic effect of mitochondrial DNA mutations. Screening of a few selected genetic variants in candidate genes involved in mitochondrial biogenesis failed to reveal any significant association. Our study provides a valuable mechanism to explain variability of penetrance in Leber's hereditary optic neuropathy and clues for high throughput genetic screening to identify the nuclear modifying gene(s), opening an avenue to develop predictive genetic tests on disease risk and therapeutic strategies.

Keywords: LHON penetrance; mitochondrial biogenesis; mtDNA copy number.


Figures

Figure 1
Figure 1
Analysis of mitochondrial DNA (mtDNA) content in three LHON pedigrees and an Italian cohort. (A) Scatter-plot of mitochondrial DNA copy number per cell with means ± SD for affected and unaffected mutation carriers from three large LHON pedigrees harbouring the m.11778G>A/MT-ND4 mutation and for controls. Both affected and carriers showed increased mitochondrial DNA content compared with controls (affected versus controls, P < 0.0001; carriers versus controls P < 0.00001). Carriers showed increased mitochondrial DNA content compared with affected individuals (P < 0.0001). (B) Frequency distribution of mitochondrial DNA copy number per cell from the same three families showed that the peak of mitochondrial DNA content shifts towards higher values from controls to affected to carriers. (C) Scatter-plot of mitochondrial DNA copies per cell with means ± SD for a large Italian cohort with all the three primary LHON mutations. Unaffected carriers showed increased mitochondrial DNA content compared with affected subjects (P < 0.0001). (D) Frequency distribution of mitochondrial DNA copy number per cell from the large Italian cohort showed that the peak of mitochondrial DNA content shifts progressively towards higher values from controls to carriers. Experiments were performed in triplicates for all samples. Asterisks indicate statistical significance (*P < 0.0001; **P < 0.00001, ANOVA test).
Figure 2
Figure 2
Affected/carrier and gender discrimination by mitochondrial DNA content in blood cells and correlation with subclinical signs of disease in carriers. (A) Density of mitochondrial DNA copy number per cell obtained by normal mixture model applied to the overall data set. The model identified three populations that fitted the frequency distribution of controls (blue bars), affected individuals (red bars) and carriers (green bars). (B) Logistic regression analysis applied on the same overall data set discriminating affected/carrier status and accounting for gender. Circles in the upper line represent carrier individuals, circles in the bottom line represent affected individuals, red circles are females; black circles are males. The probability of being affected or a carrier is predicted by the blood mitochondrial DNA content with thresholds of >600 and <300 mitochondrial DNA copies per cell, respectively. Females (red line) presented a shifted probability curve as compared with males (black line). (C) Scatter-plot of mitochondrial DNA copies per cell with median and interquartile range for a subset of unaffected carriers from the large Family 1, classified using the fundus and the contrast sensitivity evaluation as normal or abnormal (AA = abnormal fundus and abnormal contrast; AN = abnormal fundus, normal contrast; NA = normal fundus, abnormal contrast; NN = normal fundus and normal contrast) (P = 0.05 for fundus effect; P < 0.02 for contrast effect, two-way ANOVA).
Figure 3
Figure 3
Mitochondrial DNA copy number and global mitochondrial biogenesis in white blood cells. (A) Scatter-plot of mitochondrial DNA copy number per cell with mean ± SD. The increase of mitochondrial DNA content was confirmed in both affected individuals and carriers compared with controls and in carriers compared with affected individuals (affected versus controls, P < 0.01; carriers versus controls, P < 0.001; carriers versus affected, P = 0.05). (B) Messenger RNA relative expression (mean ± SEM) of PPRC1, NRF1 and TFAM. Significant increase of TFAM and PPRC1 gene expression was found in carriers compared with controls. (C and D) Mitochondrial proteins expression: representative western blot and densitometry are shown (mean ± SEM). The quantification showed a generalized increase of all proteins content in individuals carrying the LHON mutation compared with controls, higher for carriers, although the statistical significance was not reached. Core2 = Cytochrome b-c1 complex subunit 2; CS = citrate synthetase; MnSOD = manganese superoxide dismutase. Experiments were performed in triplicates for all samples. Asterisks indicate statistical significance: *P < 0.05, **P < 0.01, ANOVA test.
Figure 4
Figure 4
Mitochondrial biogenesis in skeletal muscle from controls, affected individuals and carriers. (A) Scatter-plot of mitochondrial DNA/nuclear DNA ratio with mean ± SD for skeletal muscle of controls, affected individuals and carriers belonging to the Italian cohort. A higher mitochondrial DNA content was confirmed in both affected individuals and carriers compared with controls and in carriers compared with affected subjects (affected versus controls, P < 0.001; carriers versus controls, P < 0.001; carriers versus affected, P < 0.05). (B) Mitochondrial DNA/nuclear DNA ratio from skeletal muscle in three pairs of discording brothers. All three carriers showed a higher mitochondrial DNA content compared with the affected brother. (C) TFAM messenger RNA relative expression (mean ± SD) in the skeletal muscle of the three pairs of discording brothers. All three carriers exhibited a higher TFAM expression compared with the affected brothers. Experiments were performed in triplicate for all samples. (D) Succinic dehydrogenase (SDH) and ATPase pH 9.4 staining in skeletal muscle from controls, affected and carriers. Both affected and carriers presented an increased intensity of subsarcolemmal succinic dehydrogenase staining as compared with controls, especially evident in carriers. Muscle from the affected individual showed variability in fibre size (succinic dehydrogenase, Scale bar = 100 μm; ATPase pH 9.4, Scale bar = 200 μm). (E) Scatter-plot of frequency of type I fibres (mean ± SD) in skeletal muscle from controls (n = 5), affected individuals (n = 7) and carriers (n = 4). Asterisks indicate statistical significance: *P < 0.05, **P < 0.01, ANOVA test.
Figure 5
Figure 5
Mitochondrial function and biogenesis in fibroblasts grown in galactose medium. (A) Growth rate of controls, affected and carrier-derived fibroblasts reported as the ratio between cell number counted in galactose (Gal) and in glucose (Glu) medium at 3, 5 and 10 days. Carriers significantly differed from affected individuals, which had severely impaired growth, by showing a growth rate closer to controls. (B) Intracellular ATP levels during the galactose time course, normalized on ATP level in glucose medium at each time point. ATP content significantly increased in controls and carriers but decreased in affected individuals. (C) Level of l-lactate during the galactose time course normalized to the level in glucose at each time point. In all groups l-lactate decreased immediately after switching to galactose medium. At the following time points it increased with a higher rate in affected at 48 h. At the last time point, l-lactate in controls was significantly higher than carriers. (D) Mitochondrial DNA amount in fibroblasts (expressed as mitochondrial DNA/nuclear DNA ratio) normalized on mitochondrial DNA amount in glucose medium at each time point. During growth in galactose, carriers significantly increased mitochondrial DNA content as compared with controls and affected individuals. (E) Expression of proteins involved in mitochondrial DNA replication (TFAM, mtSSB and NRF1) in galactose medium, normalized on protein levels in glucose medium at each time point. Representative western blot and densitometry are shown (mean ± SEM). Proteins increased in carriers during growth in galactose medium, but remained unchanged in controls and affected individuals. Experiments were performed in quadruplicate for all samples. Asterisks indicate statistical significance: *P < 0.05; **P < 0.01, ANOVA test.
Figure 6
Figure 6
Mitochondrial mass and mitochondrial DNA content correlation in fibroblasts grown in galactose (Gal) medium. (A) Citrate synthetase activity (mean ± SEM) measured during the time course in galactose medium normalized on the citrate synthetase activity measured in glucose medium at each time point. Citrate synthetase activity increased after 48-, 72- and 96-h incubation in galactose in controls and carriers, whereas no significant change was observed in the affected group. (B) Citrate synthetase protein expression in galactose medium normalized on glucose medium for each time point. Citrate synthetase protein increased after 48-, 72- and 96-h incubation in galactose medium in controls and carriers, whereas it did not change in the affected group. Representative western blot and densitometry are shown (mean ± SEM). (C) Correlation between citrate synthetase activity and mitochondrial DNA content during the time course in galactose medium. Only carriers displayed a significant correlation between the increase of mitochondrial mass and mitochondrial DNA amount during the growth in galactose medium. Experiments were performed in triplicate for all samples. Asterisks indicate statistical significance: *P < 0.05; **P < 0.01, ANOVA test.
Figure 7
Figure 7
Mitochondrial DNA repopulation after depletion by ethidium bromide in fibroblasts. Mitochondrial DNA depletion and repopulation in glucose (A) and in galactose medium (B). Mitochondrial DNA content (mean ± SEM) was normalized on Day 0 before ethidium bromide treatment. In glucose medium, after mitochondrial DNA depletion, repopulation started at Day 8. At Day 12, mitochondrial DNA amount increase was most efficient in carriers, followed by affected individuals and controls. In galactose medium, controls had the most efficient repopulation rate, followed by carriers and only one cell line from an affected individual, which had the slowest repopulation rate. Experiments were performed in triplicate for all samples. Asterisks indicate statistical significance: *P < 0.05, ANOVA test.
Figure 8
Figure 8
Mitochondrial DNA content in retinal ganglion cells and nerve fibres from the macular and nasal retina. (A) Representative montage of horizontal sections through the optic nerve head (ONH) and the macula. Red circles indicate the macular and a nasal area, at equal distance from the optic nerve head, where retinal ganglion cells and the corresponding axons of the RNFL were microdissected by laser capturing for mitochondrial DNA copy number evaluation in two controls and one carrier (haematoxylin and eosin, scale bar = 200 μm). (B) Representative image of a retina before and after microdissection of retinal ganglion cells (RGC) and RNFL (haematoxylin and eosin, scale bar = 100μm). (C) The macular/nasal mitochondrial DNA ratio indicates that the mitochondrial DNA content (expressed as mitochondrial DNA copy per retinal ganglion cell nucleus) from the macular region is higher as compared with the nasal region. This ratio was even higher in the carrier. Data are mean ± SD from two experiments.
Figure 9
Figure 9
Mitochondrial DNA content in pre/post-laminar regions of sagittal optic nerve head and post-laminar optic nerve cross-sections. (A) Sagittal sections through the optic nerve of a control, a carrier and an affected individual. The control and carrier present similar features, whereas the affected subject showed markedly atrophic nerve bundles and a thinned lamina cribrosa (Masson trichrome stain, scale bar = 200 μm). (B) Representative sagittal section through the optic nerve head after microdissection of prelaminar (preL) and post-laminar (postL) areas (haematoxylin and eosin, scale bar = 200 μm). (C) The pre-/post-laminar mitochondrial DNA ratio indicates a higher mitochondrial DNA density (expressed as mitochondrial DNA molecules per µm3) in the pre-laminar region in controls (n = 6). The carrier had a lower pre-/post-laminar mitochondrial DNA ratio compared with controls. Data are mean ± SD from three experiments.(D) Post-laminar optic nerve cross-sections of a control, a carrier and an affected individual. The control and carrier displayed organized bundles of axons. The affected subject showed extensive gliosis of the temporal region and a relative sparing of axons in the other quadrants (anti-neurofilament antibody, scale bar = 500 μm). (E) Representative post-laminar optic nerve-cross section before and after microdissection of bundles of axons in the temporal (T, double nick) inferior (I), nasal (N) and superior (S, single nick) quadrants (Luxol Fast Blue, scale bar = 500 μm). (F) The superior/temporal, inferior/temporal and nasal/temporal mitochondrial DNA ratio indicate a lower mitochondrial DNA density in the temporal area, both in controls (n = 6) and the carrier. In the carrier these ratios were slightly lower compared with controls, suggesting a compensatory mitochondrial DNA increase in the temporal quadrant. Data are mean ± SD from three experiments.

Comment in

References

    1. Achanta G, Sasaki R, Feng L, Carew JS, Lu W, Pelicano H, et al. Novel role of p53 in maintaining mitochondrial genetic stability through interaction with DNA Pol gamma. EMBO J. 2005;24:3482–92. - PMC - PubMed
    1. Andrews RM, Griffiths PG, Johnson MA, Turnbull DM. Histochemical localisation of mitochondrial enzyme activity in human optic nerve and retina. Br J Ophthalmol. 1999;83:231–5. - PMC - PubMed
    1. Baracca A, Solaini G, Sgarbi G, Lenaz G, Baruzzi A, Schapira AH, et al. Severe impairment of complex I-driven adenosine triphosphate synthesis in leber hereditary optic neuropathy cybrids. Arch Neurol. 2005;62:730–6. - PubMed
    1. Barboni P, Carbonelli M, Savini G, Ramos Cdo V, Carta A, Berezovsky A, et al. Natural history of Leber's hereditary optic neuropathy: longitudinal analysis of the retinal nerve fiber layer by optical coherence tomography. Ophthalmology. 2010;117:623–7. - PubMed
    1. Barron MJ, Griffiths P, Turnbull DM, Bates D, Nichols P. The distributions of mitochondria and sodium channels reflect the specific energy requirements and conduction properties of the human optic nerve head. Br J Ophthalmol. 2004;88:286–90. - PMC - PubMed

Publication types

Substances