. 2013 Dec 23;27(6):607-20.
doi: 10.1016/j.devcel.2013.11.013.

Calpain 2 activation of P-TEFb drives megakaryocyte morphogenesis and is disrupted by leukemogenic GATA1 mutation

Affiliations

Calpain 2 activation of P-TEFb drives megakaryocyte morphogenesis and is disrupted by leukemogenic GATA1 mutation

Kamaleldin E Elagib et al. Dev Cell. .

Abstract

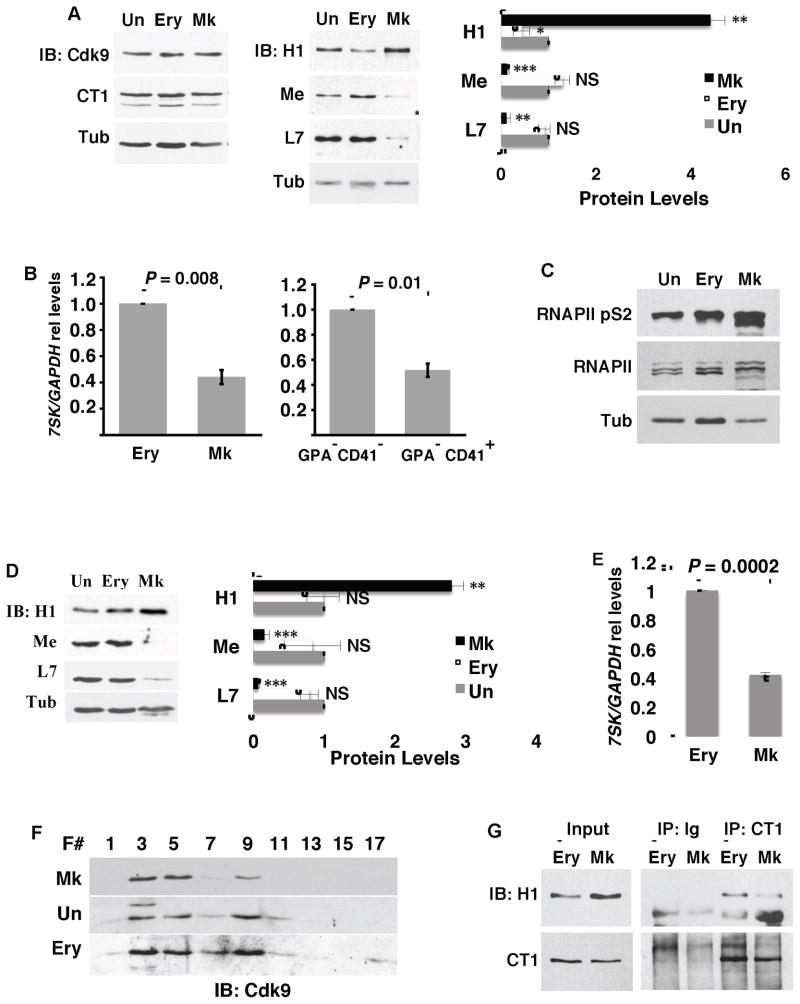
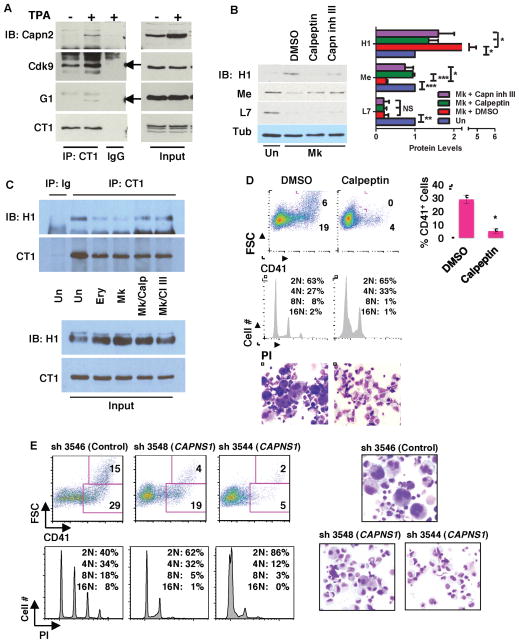
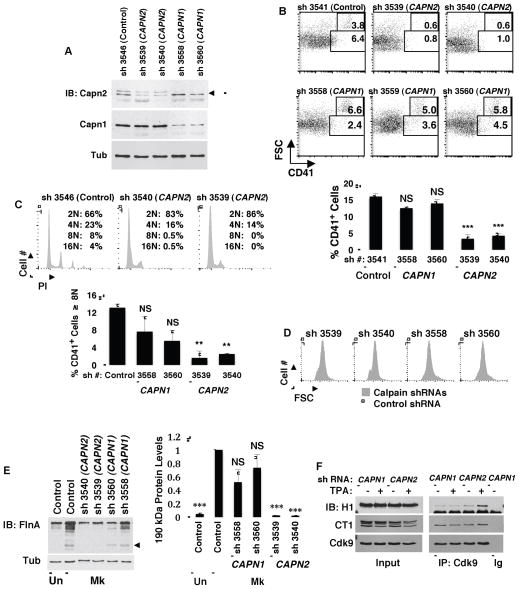
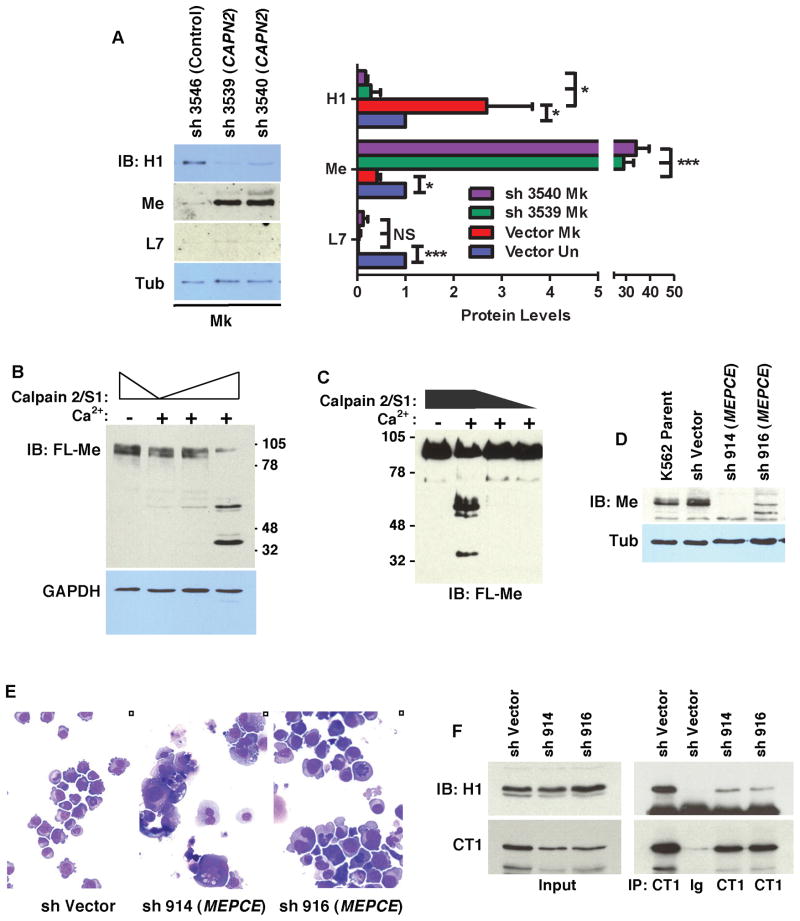
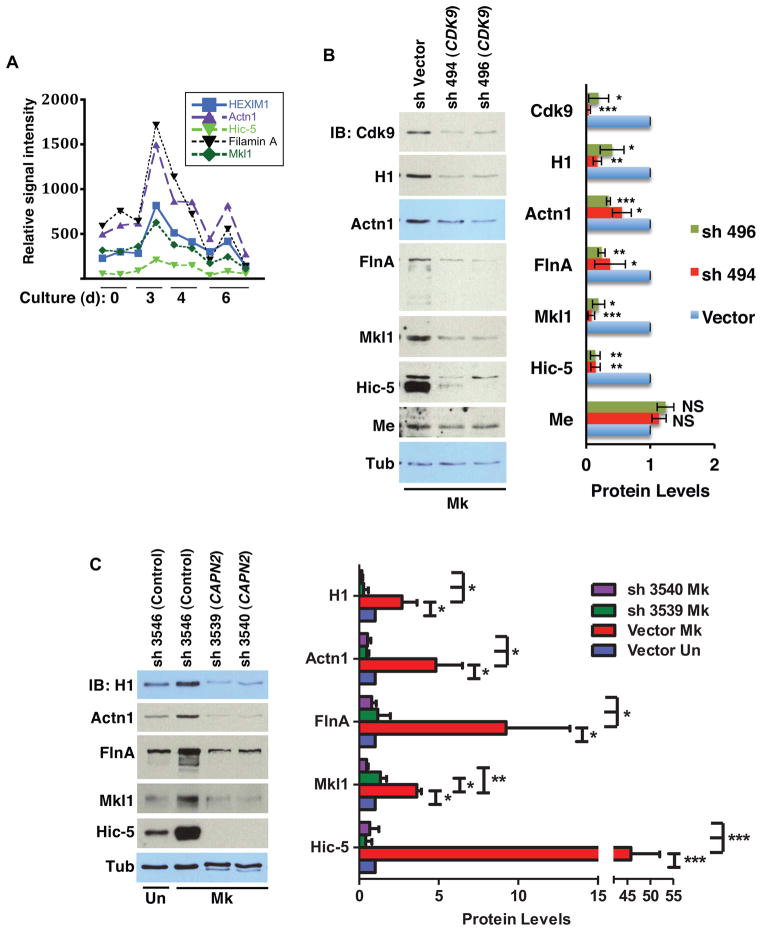
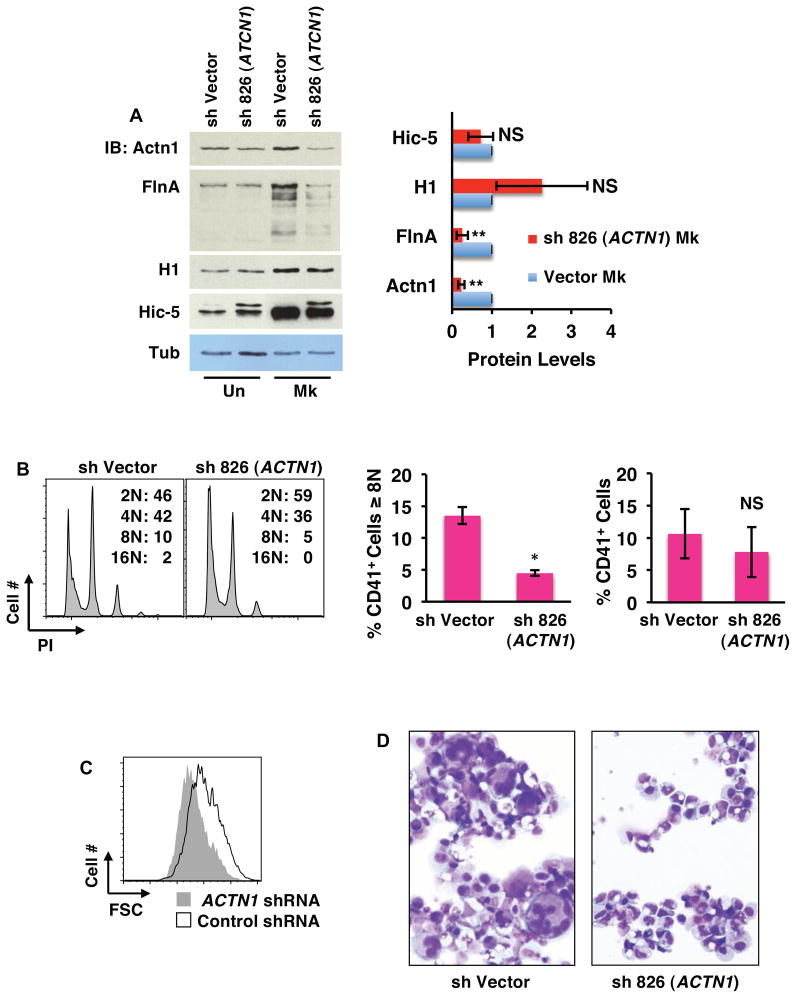
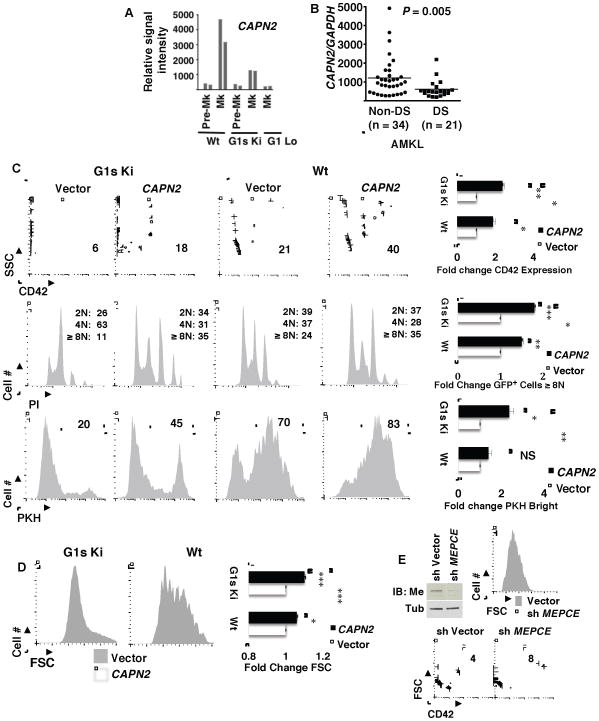
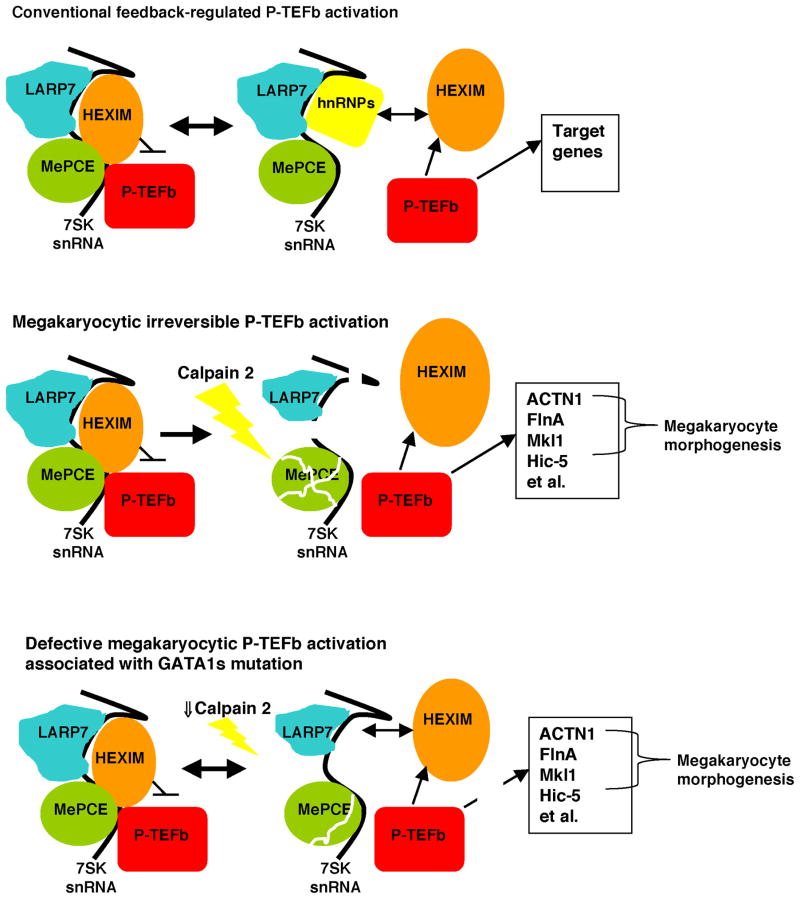
Megakaryocyte morphogenesis employs a "hypertrophy-like" developmental program that is dependent on P-TEFb kinase activation and cytoskeletal remodeling. P-TEFb activation classically occurs by a feedback-regulated process of signal-induced, reversible release of active Cdk9-cyclin T modules from large, inactive 7SK small nuclear ribonucleoprotein particle (snRNP) complexes. Here, we have identified an alternative pathway of irreversible P-TEFb activation in megakaryopoiesis that is mediated by dissolution of the 7SK snRNP complex. In this pathway, calpain 2 cleavage of the core 7SK snRNP component MePCE promoted P-TEFb release and consequent upregulation of a cohort of cytoskeleton remodeling factors, including α-actinin-1. In a subset of human megakaryocytic leukemias, the transcription factor GATA1 undergoes truncating mutation (GATA1s). Here, we linked the GATA1s mutation to defects in megakaryocytic upregulation of calpain 2 and of P-TEFb-dependent cytoskeletal remodeling factors. Restoring calpain 2 expression in GATA1s mutant megakaryocytes rescued normal development, implicating this morphogenetic pathway as a target in human leukemogenesis.


Figures

Figure 1
Figure 1. Megakaryocytic Downregulation of 7SK snRNP Core Components and Associated P-TEFb Release
(A) Analysis of 7SK snRNP protein components. (Left and middle panels) Primary human progenitors either undifferentiated (Un) or cultured for 5 days in erythroid (Ery) or megakaryocytic (Mk) medium underwent immunoblot for Cdk9, cyclin T1 (CT1), HEXIM1 (H1), MePCE (Me), LARP7 (L7), and tubulin (Tub). (Right panel) Scanning densitometry from three independent experiments conducted as in the middle panel. Results represent mean ± SEM for signals relative to those in undifferentiated cells. In addition, all signals are normalized to tubulin. * P < 0.05; ** P < 0.01; *** P < 0.005; NS, not significant. (B) (Left panel) Relative 7SK levels in human progenitors cultured as in (A). (Right panel) Relative 7SK levels in sorted CD41 GPA double negative and CD41+ GPA (Mk) cells from megakaryocytic culture. Graphs represent mean ± SEM of 7SK normalized to GAPDH in three independent experiments. (C) Phosphorylation of RNA polymerase II carboxy terminal domain serine 2 (RNAPII pS2). Human CD34+ progenitors cultured 3 days in expansion medium (Un) or 6 days in erythroid or megakaryocyte medium underwent immunoblotting of whole cell lysates for RNAPII pS2, total RNAPII, or tubulin. (D and E) HPC7 cells either undifferentiated (Un) or grown in Ery or Mk medium underwent analysis as in (A) and (B). Graphs both represent mean ± SEM for three independent experiments. *** P < 0.005. (F and G) Megakaryocytic P-TEFb release. Extracts from HPC7 cells cultured as in (D) were subjected to glycerol gradient fractionation and immunoblotting for Cdk9 (F) or cyclin T1 immunoprecipitation followed by immunoblot for HEXIM1 (G). F # = fraction number. See also Figure S1.
Figure 2
Figure 2. Calpain Contribution to Megakaryocytic P-TEFb Activation and Differentiation
(A) Analysis of Calpain 2 association with P-TEFb. Extracts from K562 cells treated with either DMSO (−) or 25nM TPA (+), underwent immunoprecipitation (IP) with antibody to cyclin T1 (CT1) or control IgG followed by immunoblotting for calpain 2 (Capn2), Cdk9 (arrow), GATA-1 (G1) (arrow), and cyclin T1 (CT1). (B) Effects of calpain inhibition on megakaryocytic MePCE downregulation and HEXIM1 upregulation. Primary human progenitors either undifferentiated (Un) or cultured in megakaryocytic medium (Mk) with DMSO, 40μM calpeptin or 20μM calpain inhibitor III (Capn inh III), underwent immunoblot and densitometry as in Figure 1A. Results from three independent experiments are shown as mean ± SEM for signals relative to those in undifferentiated cells. In addition, all signals are normalized to tubulin. * P < 0.05; ** P < 0.01; *** P < 0.005; NS, not significant. (C) Effects of calpain inhibition on P-TEFb dissociation from HEXIM1. Extracts from HPC7 cells grown 48 hours in expansion (Un), erythroid (Ery), or megakaryocytic (Mk) medium underwent immunoprecipitation for cyclin T1 (CT1) followed by immunoblotting for HEXIM1 (H1) and CT1. The cells undergoing megakaryocytic culture were treated in the final 16 hours with either DMSO, 50μM calpeptin (Calp), or 25μM Capn inh III (CI III). (D) Effects of calpain inhibition on megakaryocytic differentiation. Primary human progenitors grown for 6 days in megakaryocytic medium with DMSO or 40μM calpeptin were analyzed by flow cytometry for CD41 expression, and DNA content by propidium iodide staining (PI). Cell morphology was assessed by light microscopy of Wright-stained cytospins (200X). Graph represents mean ± SEM for CD41 expression in three independent experiments; * P < 0.05. (E) Role of calpain S1 in megakaryocytic differentiation. Primary human progenitors transduced with lentiviral shRNA constructs targeting Calpain S1 (CAPNS1) underwent megakaryocytic culture for 5 days followed by analysis as in (C). For documentation of knockdown see Figure S2E. See also Figure S2.
Figure 3
Figure 3. Implication of Calpain 2 as the Isoenzyme Involved in Megakaryocytic Differentiation
(A) Specificity of calpain 1 and 2 knockdowns. Primary human progenitors transduced with lentiviral shRNA constructs targeting calpain 1 (CAPN1) or 2 (CAPN2) were analyzed by immunoblot. Arrow: calpain 2; band above arrow: lot-dependent cross-reactivity of antibody to calpain 1; smear below arrow: most likely autolyzed calpain 2. (B and C) Relative contributions of calpain 1 versus 2 to megakaryocytic differentiation. Progenitors transduced with lentiviral shRNA constructs as in (A) were analyzed for megakaryocytic differentiation as in Figure 2E. Graphs represent mean ± SEM for CD41 expression or for percentage of CD41+ cells with DNA content of ≥ 8N, with both graphs derived from three independent experiments; ** P < 0.01; *** P < 0.005; NS, not significant. (D) Relative contributions of calpain 1 versus 2 to cellular enlargment during megakaryopoiesis. Forward scatter (FSC) profiles of cells subjected to shRNA knockdowns and culture as in (B). (E) Relative contributions of calpain 1 versus 2 to filamin A cleavage associated with megakaryocytic differentiation. (Left panel) Human progenitors transduced with shRNA constructs as (A) underwent megakaryocytic culture followed by immunoblotting for filamin A (FlnA). Arrow indicates 190 kd cleavage fragment. (Right panel) Densitometric analysis of 190 kd cleavage fragment from three independent experiments performed as in Left panel. Graph represents mean ± SEM; *** P < 0.005. (F) Relative contributions of calpain 1 versus 2 to HEXIM1 dissociation from P-TEFb. K562 cells expressing shRNAs knocking down either calpain 1 or calpain 2 underwent induction with TPA (25nM 48 hours) followed by immunoprecipitation of Cdk9 and immunoblotting for HEXIM1 (H1), cyclin T1 (CT1) and Cdk9.
Figure 4
Figure 4. Involvement of Calpain 2 in Megakaryocytic Downregulation of MePCE and Consequences of MePCE Downregulation
(A) Effects of calpain 2 knockdown on MePCE (Me), HEXIM1 (H1) and LARP7 (L7) levels. Cells transduced and cultured as in Figure 3B underwent immunoblotting followed by scanning densitometry. Graph depicts mean ± SEM for three independent experiments. * P < 0.05; ** P < 0.01; *** P < 0.005; NS, not significant. (B) In vitro analysis of MePCE cleavage by calpain 2. Extracts from HEK293T cells transfected with FLAG-MePCE (FL-Me) expression vector were incubated with 50 to 200ng purified calpain 2/S1 ± 2 mM CaCl2 (Ca2+) followed by immunoblot for FL-Me and GAPDH. (C) In vitro analysis of MePCE cleavage by calpain 2. Purified FL-Me protein from HEK293T transfectants was subjected to in vitro cleavage and immunoblot as in (B). (D–E) K562 cells transduced with shRNA constructs targeting MePCE underwent immunoblotting in (D). Cell morphology was assessed by light microscopy on Wright-stained cytospins (200X) in (E). (F) Effect of MePCE downregulation on P-TEFb interaction with HEXIM1. Extracts from K562 cells subjected to shRNA knockdown of MePCE underwent immunoprecipitation of cyclin T1 followed by immunoblotting for HEXIM1 (H1) and cyclin T1 (CT1) See also Figure S3.
Figure 5
Figure 5. P-TEFb and Calpain 2 Regulate a Cohort of Megakaryocytic Cytoskeletal Remodeling Factors
(A) Expression patterns of gene cohort and HEXIM1 during megakaryocytic differentiation. Plotted are normalized signals obtained from GEO DataSet Record GDS2521 comparing relative mRNA levels from murine fetal liver megakaryocytic progenitors at various developmental stages. (B) Assessment of P-TEFb influence on expression of factors identified in (A). (Left panel) Primary human progenitors transduced with shRNA constructs targeting Cdk9 were cultured in megakaryocytic medium followed by immunoblot with the indicated antibodies. (Right panel) Densitometry derived from three independent experiments conducted as in Left panel showing mean ± SEM for relative protein levels normalized to Tubulin. * P < 0.05; ** P < 0.01; *** P < 0.005; NS, not significant. HEXIM1 (H1), α-actinin 1 (Actn1), filamin A (FlnA), MePCE (Me), tubulin (Tub). (C) Assessment of calpain 2 influence on expression of factors identified in (A). Progenitors subjected to calpain 2 knockdown were analyzed as in (B). (Right panel) Densitometry derived from three independent experiments conducted as in Left panel showing mean ± SEM for relative protein levels normalized to Tubulin. * P < 0.05; ** P < 0.01; *** P < 0.005. See also Figure S4.
Figure 6
Figure 6. Contribution of α-actinin-1 to Megakaryocytic Enlargement and Polyploidization
(A) Effects of megakaryocytic knockdown of α-actinin-1 on filamin A and Hic-5 expression. Primary human progenitors transduced with shRNA targeting α-actinin-1 (ACTN1) were analyzed as in Figure 5B. (Right panel) Densitometry derived from three independent experiments conducted as in Left panel showing mean ± SEM for relative protein levels normalized to Tubulin. * P < 0.05; ** P < 0.01; NS, not significant. HEXIM1 (H1), α-actinin 1 (Actn1), filamin A (FlnA), tubulin (Tub). (B–D) Effects of α-actinin-1 knockdown on megakaryocyte morphogenesis. Progenitors transduced with shRNA targeting α-actinin-1 underwent megakaryocyte morphogenesis culture followed by flow cytometry analysis as in Figure 3B–D. Cell morphology was assessed by light microscopy of Wright-stained cytospins (200X). Graphs in (B) show mean ± SEM for three independent experiments. * P < 0.05; NS, not significant. See also Figure S5.
Figure 7
Figure 7. Calpain 2 Deficiency Occurs in Megakaryocytic Cells with Mutant GATA1s and Contributes to Aberrant Megakaryopoiesis
(A) Expression patterns of calpain 2 (CAPN2) in developing fetal liver megakaryocytes from wild type (Wt), GATA1s knockin (G1s Ki), and megakaryocytic GATA1 knockout (G1 Lo) mice. Plotted are normalized signals obtained from GEO DataSet Record GDS1316 comparing relative mRNA levels from murine fetal liver pre-megakaryocytes (Pre-Mk) and megakaryocytes (Mk) of the indicated strains. Paired bars represent two independent experiments. (B) Calpain 2 expression in human megakaryocytic proliferative disorders bearing the GATA1s mutation. Plotted are normalized signals obtained from GEO DataSet Record GSE4119 comparing relative mRNA levels from cases of acute megakaryoblastic leukemia occurring in patients with Down syndrome (DS-AMKL) vs cases unassociated with Down syndrome (Non-DS-AMKL). (C–D) Effects of lentiviral-mediated calpain 2 restoration on megakaryocytic differentiation in fetal liver progenitors with GATA1s mutation. Day 13.5 fetal liver progenitors from G1s Ki and wild type (Wt) mice underwent transduction with calpain 2 or control lentiviral expression constructs, followed by megakaryocytic culture and flow cytometric analysis. GFP+ transduced cells were analyzed for expression of CD42, ploidy (PI), megakaryocytic growth arrest (PKH26 retention in CD41+ cells), and megakaryocytic cell size (FSC in CD41+ cells). Each of the four graphs in C–D represents mean ± SEM for three independent experiments. Graphic results are presented as fold change relative to vector transduced cells within each strain; * P < 0.05; ** P < 0.01; *** P < 0.005; NS, not significant. (E) Impact of MePCE knockdown on megakaryocyte differentiation in G1S Ki fetal liver cells. Embryonic day 13.5 fetal liver cells were transduced with lentiviral shRNA constructs, selected in puromycin, subjected to Mk culture, and analyzed for size (FSC) and CD42 upregulation. Immunoblot on left shows knockdown of MePCE in MEL cells transduced with the shRNA to MEPCE (A5). See also Figure S6.
Figure 8
Figure 8. A Model Depicting Pathway for P-TEFb Activation in Megakaryopoiesis and Perturbation of this Pathway by a Leukemogenic GATA1 Mutation
In the top panel, non megakaryocytic cells such as erythroblasts show reversible, feedback regulated P-TEFb activation in which P-TEFb and HEXIM1 reversibly associate with the 7SK snRNP. In this scenario, the majority of P-TEFb resides within the large inactive complex. In the middle panel, megakaryocytes show global and irreversible P-TEFb activation. In this scenario, calpain 2 undergoes upregulation and activation, promoting 7SK snRNP destruction through direct proteolysis of MePCE. An additional contribution derives from calpain-independent LARP7 downregulation. In the absence of the 7SK snRNP, chronic unopposed P-TEFb activation drives transcription of a cohort of genes that includes cytoskeletal remodeling factors that promote megakaryocyte morphogenesis and HEXIM1. In the bottom panel, megakaryocytic upregulation of calpain 2 is impaired in cells bearing the leukemogenic GATA1s mutation. These cells show impairment in the destruction of the 7SK snRNP, retain capacity for feedback inhibition of P-TEFb, and are compromised in the activation of key P-TEFb target genes.

Comment in

References

    1. Barboric M, Lenasi T, Chen H, Johansen EB, Guo S, Peterlin BM. 7SK snRNP/P-TEFb couples transcription elongation with alternative splicing and is essential for vertebrate development. Proc Natl Acad Sci USA. 2009;106:7798–7803. - PMC - PubMed
    1. Bartholomeeusen K, Xiang Y, Fujinaga K, Peterlin BM. BET bromodomain inhibition activates transcription via a transient release of P-TEFb from 7SK snRNP. J Biol Chem. 2012 epub ahead of print. - PMC - PubMed
    1. Begonja AJ, Hoffmeister KM, Hartwig JH, Falet H. FlnA-null megakaryocytes prematurely release large and fragile platelets that circulate poorly. Blood. 2011;118:2285–2295. - PMC - PubMed
    1. Bottardi S, Zmiri FA, Bourgoin V, Ross J, Mavoungou L, Milot E. Ikaros interacts with P-TEFb and cooperates with GATA-1 to enhance transcription elongation. Nucl Acids Res. 2011;39:3505–3519. - PMC - PubMed
    1. Bourquin JP, Subramanian A, Langebrake C, Reinhardt D, Bernard O, Ballerini P, Baruchel A, Cave H, Dastugue N, Hasle H, Kaspers GL, Lessard M, Michaux L, Vyas P, van Wering E, Zwaan CM, Golub TR, Orkin SH. Identification of distinct molecular phenotypes in acute megakaryoblastic leukemia by gene expression profiling. Proc Natl Acad Sci USA. 2006;103:3339–3344. - PMC - PubMed

Publication types

MeSH terms