Review
. 2014 Mar;21(3):256-65.
doi: 10.2174/09298665113209990077.

Characterization of protein unfolding with solid-state nanopores

Affiliations
Review

Characterization of protein unfolding with solid-state nanopores

Jiali Li et al. Protein Pept Lett. 2014 Mar.

Abstract

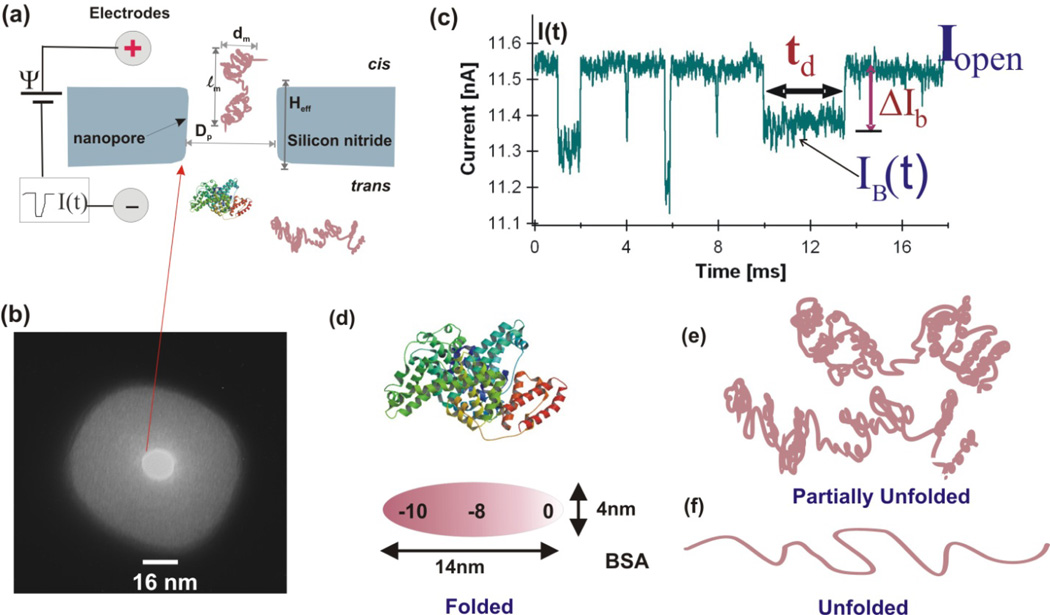
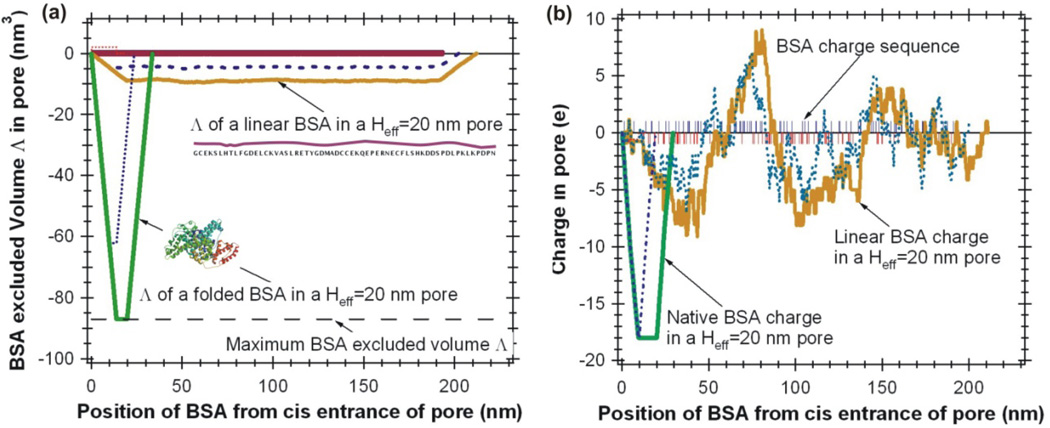
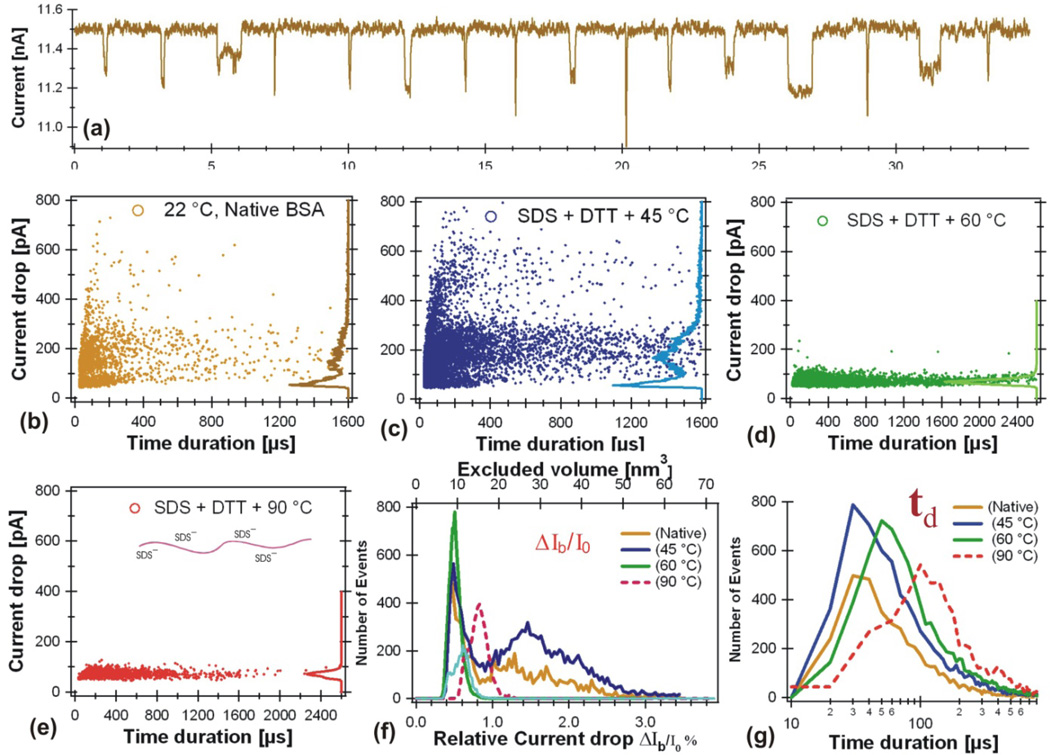
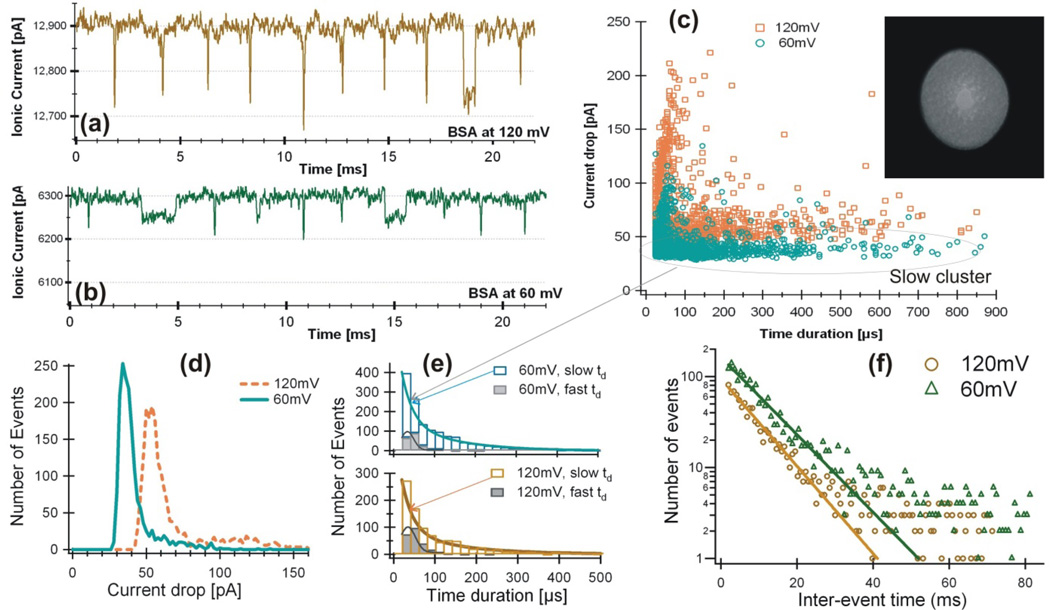
In this work, we review the process of protein unfolding characterized by a solid-state nanopore based device. The occupied or excluded volume of a protein molecule in a nanopore depends on the protein's conformation or shape. A folded protein has a larger excluded volume in a nanopore thus it blocks more ionic current flow than its unfolded form and produces a greater current blockage amplitude. The time duration a protein stays in a pore also depends on the protein's folding state. We use Bovine Serum Albumin (BSA) as a model protein to discuss this current blockage amplitude and the time duration associated with the protein unfolding process. BSA molecules were measured in folded, partially unfolded, and completely unfolded conformations in solid-state nanopores. We discuss experimental results, data analysis, and theoretical considerations of BSA protein unfolding measured with silicon nitride nanopores. We show this nanopore method is capable of characterizing a protein's unfolding process at single molecule level. Problems and future studies in characterization of protein unfolding using a solid-state nanopore device will also be discussed.


Figures

Figure 1
Figure 1
(a) Schematic diagram of a nanopore experiment setup. (b) A TEM image of a ~16 nm pore used for BSA measurement. (c) Several recorded BSA current blockage events in partially denatured condition (SDS+DTT+45 °C at pH 7 and 1M KCl measured with the nanopore shown in (b). (d) Illustration of one of the possible conformations of a BSA protein at native state (PDB, 3v03). (e) Possible partially denatured form of BSA. (f) completely unfolded form of a BSA molecule.
Figure 2
Figure 2
(a) Predicted excluded volume of BSA in a nanopore at folded globular state and unfolded linear shape in a Heff=20 nm pore (solid lines) and Heff=10 nm pore (dotted lines). (b) Predicted electrical charge of a BSA in a nanopore at folded globular state and unfolded linear shape (without SDS) in a Heff=20 nm pore (solid lines) and Heff=10 nm pore (dotted lines). The BSA protein sequence was obtained from: http://www.rcsb.org/pdb/explore/remediatedSequence.do?structureId=3V03.
Figure 3
Figure 3
BSA unfolding states measured in a ~16 nm pore (Fig. 1b) in 1M KCl at pH 7. (a) Current drop events observed for BSA in 1M KCl at pH 7 with no denaturant. The stock BSA sample contains 1.4 mg SDS (4.85 mM) and 2mM DTT with 1 mg BSA (15µM) in 1ml 1M KCl solution were kept for 5 minutes at the higher temperature indicated in the figures, than immediately cooled down in a water bath kept at room temperature. The BSA protein was then added to the cis chamber. The bias voltage was Ψ=120 mV. The open pore current was ΔI0=11.5 (b), 11.5 (c), 13.4 (d), and 8.7 (e) nA respectively. (f) Number of events distributions vs ΔIb/I0 for data shown in panels b, c, e, and d. (g) Number of events distributions vs td for data shown in panels b, c, e, and d. The final concentration of the BSA protein in the cis chamber was about 12 nM for all the measurements. The final concentrations of SDS and DTT were 3.9 µM and 1.6 µM respectively.
Figure 4
Figure 4
BSA protein in 6M Guanidine Hydrochloride solution measured by a pore of Dp=18±2 nm. Examples of current blockage events at 120 mV (a, I0=12.9 nA), 60 mV (b, I0=6.3 nA), and ΔIb vs I0 (c). The nanopore used for this experiment is shown in the insert of (c). Histogram distributions are shown for current blockage ΔIb (d), time duration td (e), and the interval between events (f).
Figure 5
Figure 5
For the native state BSA, I0=13.2 nA in 1M KCl at 120 mV during the measurement. Voltage dependence of the time duration distributions measured by the nanopore (a), the most probable values of td as a function of voltages (b, ◇), Computer simulated time histograms vs voltage (c). For the 7k dsDNA, I0=11.5±1.5 nA in 1M KCl at 120 mV during the experiment. Voltage dependence of the time duration distributions measured by the nanopore (d), the most probable values of td as a function of voltages (e), Computer simulated time durations vs voltage (f). Error bars were the standard deviation from Gaussian fit to the data.

Similar articles

Cited by

References

    1. Dobson CM. Protein folding and misfolding. Nature. 2003;426:884–890. - PubMed
    1. Eftink MR. The Use of Fluorescence Methods to Monitor Unfolding Transitions in Proteins. Biophys. J. 1994;66:482–501. - PMC - PubMed
    1. Meinhold DW, Wright PE. Measurement of protein unfolding/refolding kinetics and structural characterization of hidden intermediates by NMR realaxation dispersion. PNAS. 2011 May 11; - PMC - PubMed
    1. Daggett V, Levitt M. Protein Unfolding Pathways Explored through Molecular Dynamics Simulations. J. Mol. Biol. 1993;(232):600–619. - PubMed
    1. Oukhaled G, Mathe J, Biance A-L, Bacri L, Betton J-M, Lairez D, Pelta J, Auvray L. Unfolding of Proteins and Long Transient Conformations Detected by Single Nanopore Recording. Phys. Rev. Lett. 2007;98 - PubMed

Publication types

Substances