

Renal relevant radiology: renal functional magnetic resonance imaging
- PMID: 24370767
- PMCID: PMC3913228
- DOI: 10.2215/CJN.02900313
Renal relevant radiology: renal functional magnetic resonance imaging
Abstract
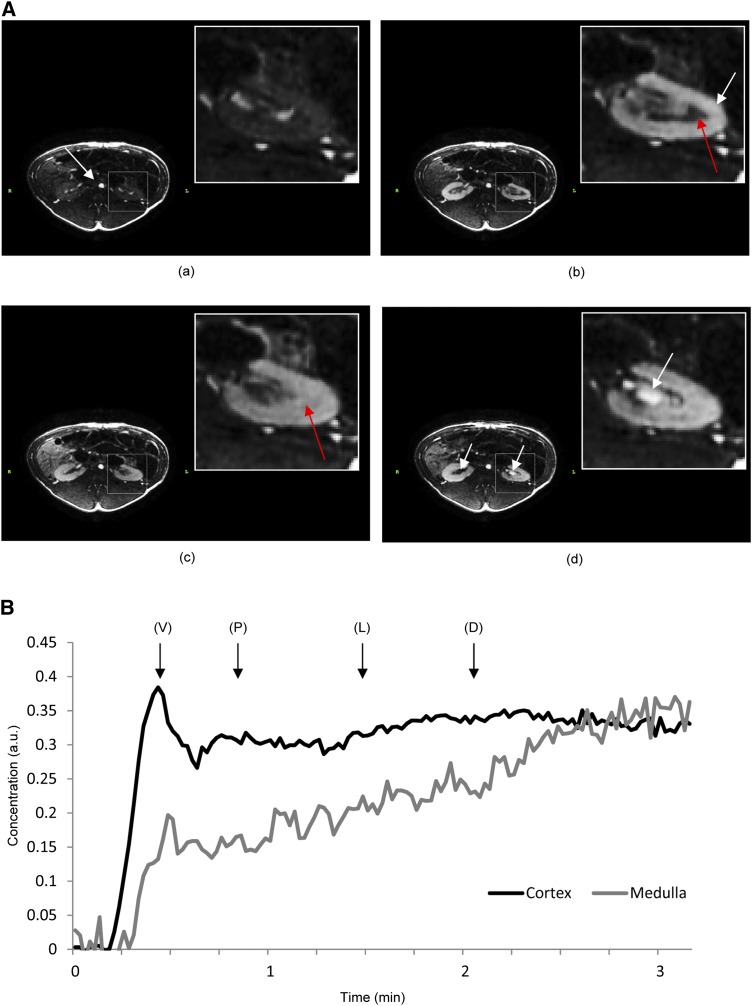
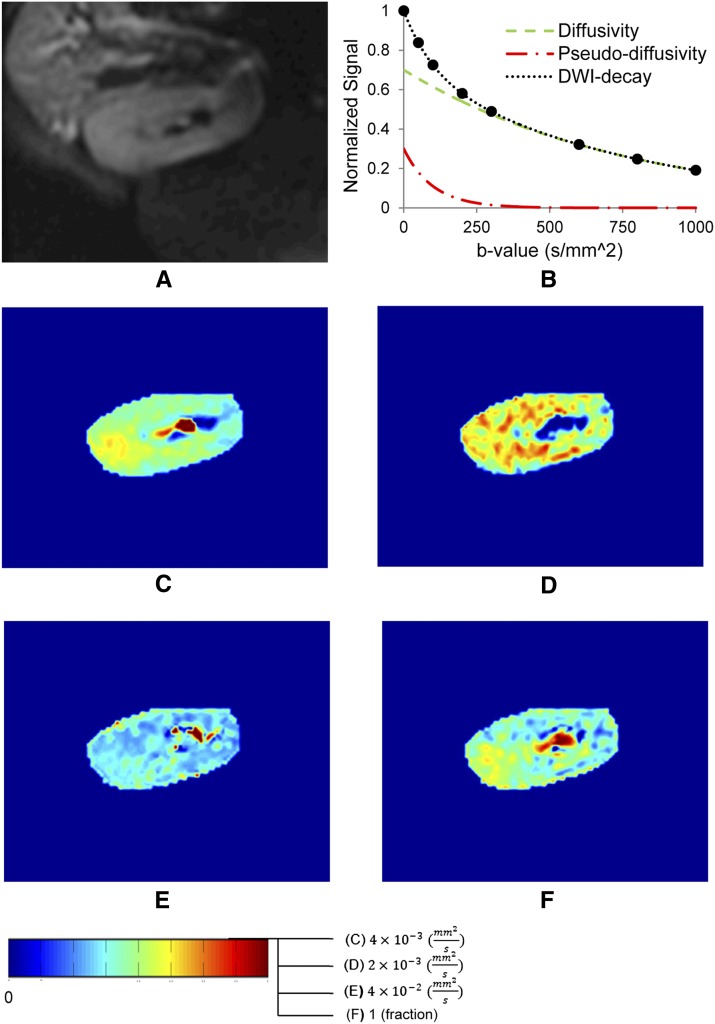
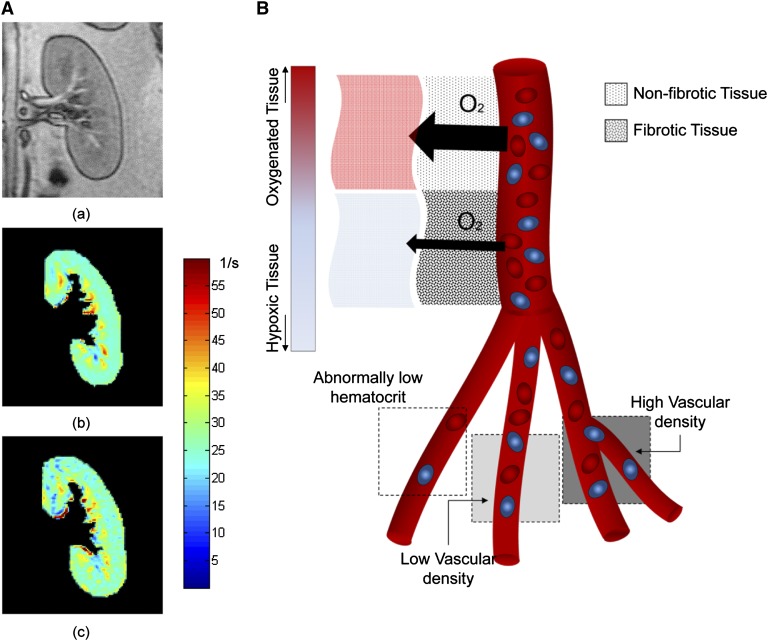
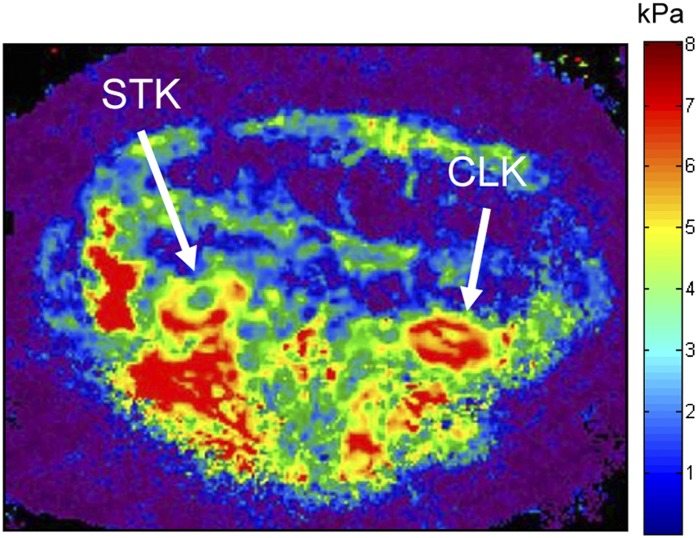
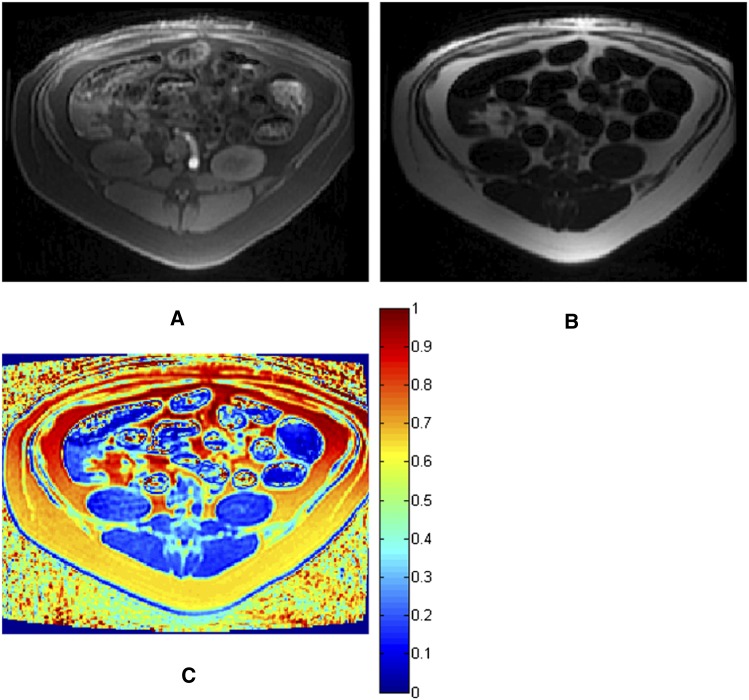
Because of its noninvasive nature and provision of quantitative measures of a wide variety of physiologic parameters, functional magnetic resonance imaging (MRI) shows great potential for research and clinical applications. Over the past decade, application of functional MRI extended beyond detection of cerebral activity, and techniques for abdominal functional MRI evolved. Assessment of renal perfusion, glomerular filtration, interstitial diffusion, and parenchymal oxygenation turned this modality into an essential research and potentially diagnostic tool. Variations in many renal physiologic markers can be detected using functional MRI before morphologic changes become evident in anatomic magnetic resonance images. Moreover, the framework of functional MRI opened a window of opportunity to develop novel pathophysiologic markers. This article reviews applications of some well validated functional MRI techniques, including perfusion, diffusion-weighted imaging, and blood oxygen level-dependent MRI, as well as some emerging new techniques such as magnetic resonance elastography, which might evolve into clinically useful tools.
Figures
Similar articles
-
Noncontrast functional MRI of the kidneys.Curr Urol Rep. 2012 Feb;13(1):99-107. doi: 10.1007/s11934-011-0229-6. Curr Urol Rep. 2012. PMID: 22102220 Review.
-
Magnetic Resonance Imaging-Derived Renal Oxygenation and Perfusion During Continuous, Steady-State Angiotensin-II Infusion in Healthy Humans.J Am Heart Assoc. 2016 Mar 28;5(3):e003185. doi: 10.1161/JAHA.115.003185. J Am Heart Assoc. 2016. PMID: 27021686 Free PMC article.
-
Functional MRI of the kidneys.J Magn Reson Imaging. 2013 Feb;37(2):282-93. doi: 10.1002/jmri.23717. J Magn Reson Imaging. 2013. PMID: 23355431 Free PMC article. Review.
-
Diffusion and perfusion of the kidney.Eur J Radiol. 2010 Dec;76(3):337-47. doi: 10.1016/j.ejrad.2010.05.033. Epub 2010 Jun 26. Eur J Radiol. 2010. PMID: 20580179 Review.
-
Could MRI Be Used To Image Kidney Fibrosis? A Review of Recent Advances and Remaining Barriers.Clin J Am Soc Nephrol. 2017 Jun 7;12(6):1019-1028. doi: 10.2215/CJN.07900716. Epub 2017 Mar 15. Clin J Am Soc Nephrol. 2017. PMID: 28298435 Free PMC article. Review.
Cited by
-
Renal imaging at 5 T versus 3 T: a comparison study.Insights Imaging. 2022 Sep 24;13(1):155. doi: 10.1186/s13244-022-01290-9. Insights Imaging. 2022. PMID: 36153471 Free PMC article.
-
Patterns of cortical oxygenation may predict the response to stenting in subjects with renal artery stenosis: A radiomics-based model.J Cardiovasc Magn Reson. 2024 Summer;26(1):100993. doi: 10.1016/j.jocmr.2024.100993. Epub 2024 Jan 11. J Cardiovasc Magn Reson. 2024. PMID: 38218433 Free PMC article.
-
Approach to atherosclerotic renovascular disease: 2016.Clin Kidney J. 2016 Oct;9(5):713-21. doi: 10.1093/ckj/sfw079. Epub 2016 Sep 16. Clin Kidney J. 2016. PMID: 27679718 Free PMC article.
-
[Functional MRI assessment of microstructural and perfusion changes in the kidneys of rats with intrauterine growth restriction].Zhongguo Dang Dai Er Ke Za Zhi. 2024 Mar 15;26(3):289-296. doi: 10.7499/j.issn.1008-8830.2309004. Zhongguo Dang Dai Er Ke Za Zhi. 2024. PMID: 38557382 Free PMC article. Chinese.
-
Analysis Protocol for Dynamic Contrast Enhanced (DCE) MRI of Renal Perfusion and Filtration.Methods Mol Biol. 2021;2216:637-653. doi: 10.1007/978-1-0716-0978-1_38. Methods Mol Biol. 2021. PMID: 33476028 Free PMC article.
References
-
- Prowle JR, Molan MP, Hornsey E, Bellomo R: Measurement of renal blood flow by phase-contrast magnetic resonance imaging during septic acute kidney injury: A pilot investigation. Crit Care Med 40: 1768–1776, 2012 - PubMed
-
- Aumann S, Schoenberg SO, Just A, Briley-Saebo K, Bjørnerud A, Bock M, Brix G: Quantification of renal perfusion using an intravascular contrast agent (part 1): Results in a canine model. Magn Reson Med 49: 276–287, 2003 - PubMed
-
- Dujardin M, Sourbron S, Luypaert R, Verbeelen D, Stadnik T: Quantification of renal perfusion and function on a voxel-by-voxel basis: A feasibility study. Magn Reson Med 54: 841–849, 2005 - PubMed
-
- Schoenberg SO, Aumann S, Just A, Bock M, Knopp MV, Johansson LO, Ahlstrom H: Quantification of renal perfusion abnormalities using an intravascular contrast agent (part 2): Results in animals and humans with renal artery stenosis. Magn Reson Med 49: 288–298, 2003 - PubMed
-
- Lerman LO, Schwartz RS, Grande JP, Sheedy PF, Romero JC: Noninvasive evaluation of a novel swine model of renal artery stenosis. J Am Soc Nephrol 10: 1455–1465, 1999 - PubMed
Publication types
MeSH terms
Grants and funding
LinkOut - more resources
Full Text Sources
Other Literature Sources
Medical
Miscellaneous
