

Review
doi: 10.1101/cshperspect.a020735.
The spatiotemporal organization of ErbB receptors: insights from microscopy
Affiliations
- PMID: 24370847
- PMCID: PMC3941232
- DOI: 10.1101/cshperspect.a020735
Item in Clipboard
Review
The spatiotemporal organization of ErbB receptors: insights from microscopy
Cold Spring Harb Perspect Biol.
.
Abstract
Signal transduction is regulated by protein-protein interactions. In the case of the ErbB family of receptor tyrosine kinases (RTKs), the precise nature of these interactions remains a topic of debate. In this review, we describe state-of-the-art imaging techniques that are providing new details into receptor dynamics, clustering, and interactions. We present the general principles of these techniques, their limitations, and the unique observations they provide about ErbB spatiotemporal organization.
Figures

Summary of imaging techniques for quantifying receptor clustering, dynamics, and interactions.
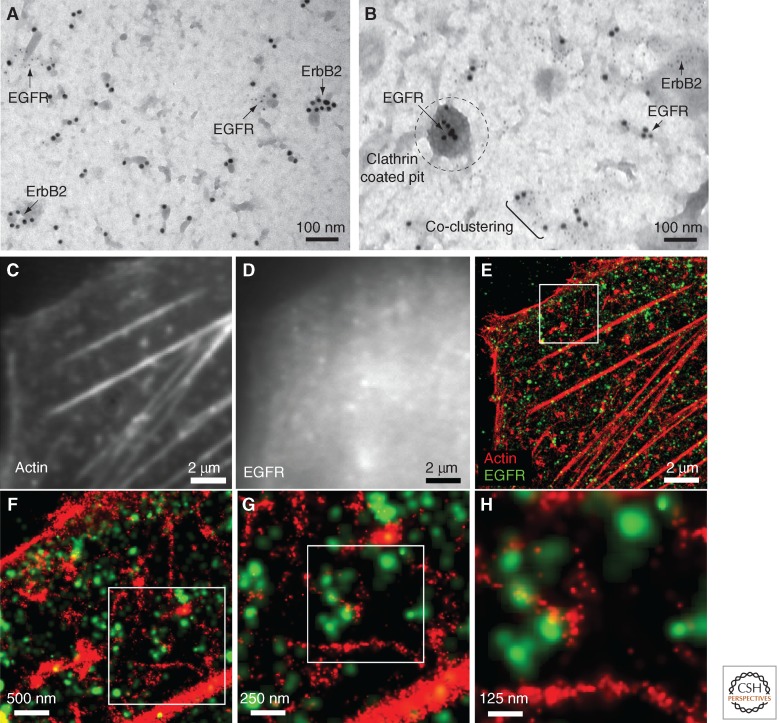
High-resolution imaging of receptor distribution. (A,B) Transmission electron microscopy images of ErbB1/ErbB2 distribution on SKBR3 membrane sheets. Dual labeling (10-nm and 5-nm gold) allows for mapping of ErbB1 and ErbB2 proximity. Note the localization of ErbB1 to a clathrin-coated pit in (B). Images courtesy of Bridget Wilson created from data based on Yang et al. (2007). (C)–(H) Two-color stochastic optical reconstruction microscopy (STORM) imaging of ErbB1 with respect to actin on Chinese hamster ovary cells stably expressing ErbB1. Diffraction-limited images of actin (C) and ErbB1 (D) as imaged on the basal cell surface using TIRF microscopy. Super-resolution reconstruction overlay (E) of actin (red, phalloidin-AlexaFluor647) and ErbB1 (green, anti-ErbB1 antibody conjugated to Cy3b) showing the subdiffraction resolution attained using STORM and the localization of ErbB1 within the actin cytoskeleton. The reconstruction overlay is shown at increasing zoom (white boxes) to highlight imaging resolution (F,G,H).
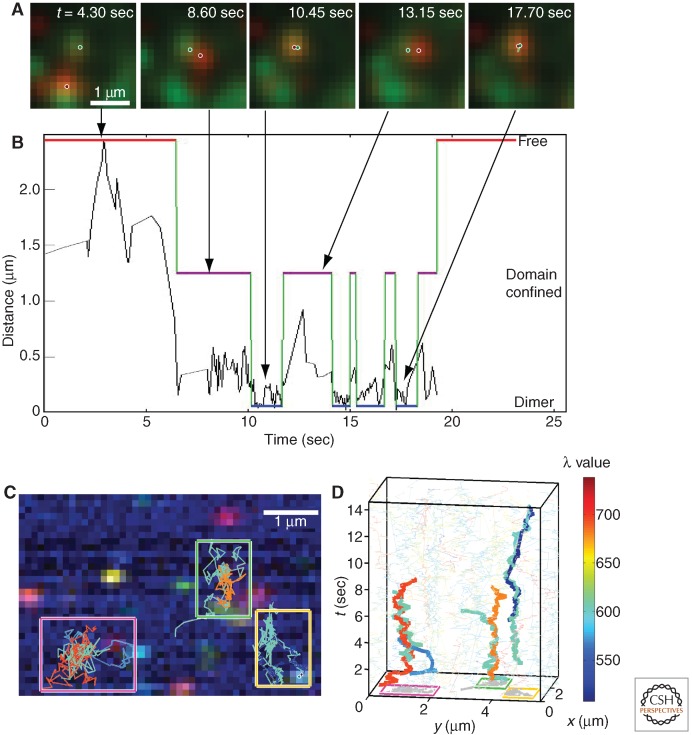
SPT captures dimerization of EGF-bound ErbB1. (A) Images from a time series in which EGF-QD585 (green) and EGF-QD655 (red) are simultaneously tracked. The pixelated image shows the raw data, and the circles indicate the subdiffraction localization of individual receptor molecules. (B) Plot showing the separation over time of the two receptors in (A). Particle trajectories are analyzed using a three-state hidden Markov model based on interparticle distance to distinguish between free (red line), confined (purple line), and dimeric (blue line) receptor populations. In this example, the EGF-bound receptors are seen to undergo repeated (four) dimerization events (see also Low-Nam et al. 2011). (C) Hyperspectral imaging of eight spectrally distinct QDs bound to EGF. Pseudocoloring of the data is generated based on each quantum dot’s (QD) peak spectral wavelength (λ). (D) Three-dimensional particle trajectories (x,y,t) of the corresponding boxed regions in (C). Correlated motion of dimerized receptors can be observed. Color map (right) indicates QD emission peak. (Images from Cutler et al. 2013; reprinted, with permission, from the investigators.)
Similar articles
-
Imaging spatiotemporal dynamics of neuronal signaling using fluorescence resonance energy transfer and fluorescence lifetime imaging microscopy.Curr Opin Neurobiol. 2006 Oct;16(5):551-61. doi: 10.1016/j.conb.2006.08.012. Epub 2006 Sep 12. Curr Opin Neurobiol. 2006. PMID: 16971112 Review.
-
FRET Microscopy for Real-Time Visualization of Second Messengers in Living Cells.Methods Mol Biol. 2017;1563:85-90. doi: 10.1007/978-1-4939-6810-7_6. Methods Mol Biol. 2017. PMID: 28324603
-
A tale of the epidermal growth factor receptor: The quest for structural resolution on cells.Methods. 2016 Feb 15;95:86-93. doi: 10.1016/j.ymeth.2015.10.009. Epub 2015 Oct 17. Methods. 2016. PMID: 26484734 Review.
-
Fluorescence resonance energy transfer (FRET) microscopy imaging of live cell protein localizations.J Cell Biol. 2003 Mar 3;160(5):629-33. doi: 10.1083/jcb.200210140. J Cell Biol. 2003. PMID: 12615908 Free PMC article. Review.
-
Graphical representation and multicomponent analysis of single-frequency fluorescence lifetime imaging microscopy data.J Microsc. 2004 Jan;213(1):1-5. doi: 10.1111/j.1365-2818.2004.01265.x. J Microsc. 2004. PMID: 14678506
Cited by
-
Characterizing Large-Scale Receptor Clustering on the Single Cell Level: A Comparative Plasmon Coupling and Fluorescence Superresolution Microscopy Study.J Phys Chem B. 2019 Jul 5;123(26):5494-5505. doi: 10.1021/acs.jpcb.9b05176. Epub 2019 Jun 20. J Phys Chem B. 2019. PMID: 31244098 Free PMC article.
-
Plasma Membrane Organization of Epidermal Growth Factor Receptor in Resting and Ligand-Bound States.Biophys J. 2015 Nov 3;109(9):1925-36. doi: 10.1016/j.bpj.2015.09.007. Biophys J. 2015. PMID: 26536269 Free PMC article.
-
The dependence of EGFR oligomerization on environment and structure: A camera-based N&B study.Biophys J. 2022 Dec 6;121(23):4452-4466. doi: 10.1016/j.bpj.2022.11.003. Epub 2022 Nov 5. Biophys J. 2022. PMID: 36335429 Free PMC article.
-
Counting growth factors in single cells with infrared quantum dots to measure discrete stimulation distributions.Nat Commun. 2019 Feb 22;10(1):909. doi: 10.1038/s41467-019-08754-5. Nat Commun. 2019. PMID: 30796217 Free PMC article.
-
Enhanced dimerization drives ligand-independent activity of mutant epidermal growth factor receptor in lung cancer.Mol Biol Cell. 2015 Nov 5;26(22):4087-99. doi: 10.1091/mbc.E15-05-0269. Epub 2015 Sep 2. Mol Biol Cell. 2015. PMID: 26337388 Free PMC article.
References
-
- Bader AN, Hofman EG, van Bergen En Henegouwen PM, Gerritsen HC 2007. Imaging of protein cluster sizes by means of confocal time-gated fluorescence anisotropy microscopy. Opt Express 15: 6934–6945 - PubMed
Publication types
MeSH terms
Substances
Grants and funding
LinkOut - more resources
Full Text Sources
Other Literature Sources
Research Materials
Miscellaneous