. 2014 Mar 6;426(5):1109-27.
doi: 10.1016/j.jmb.2013.12.021. Epub 2013 Dec 24.

Site-specific structural variations accompanying tubular assembly of the HIV-1 capsid protein

Affiliations

Site-specific structural variations accompanying tubular assembly of the HIV-1 capsid protein

Marvin J Bayro et al. J Mol Biol. .

Abstract

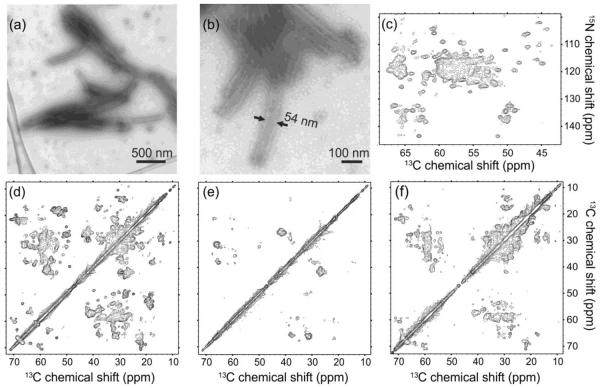
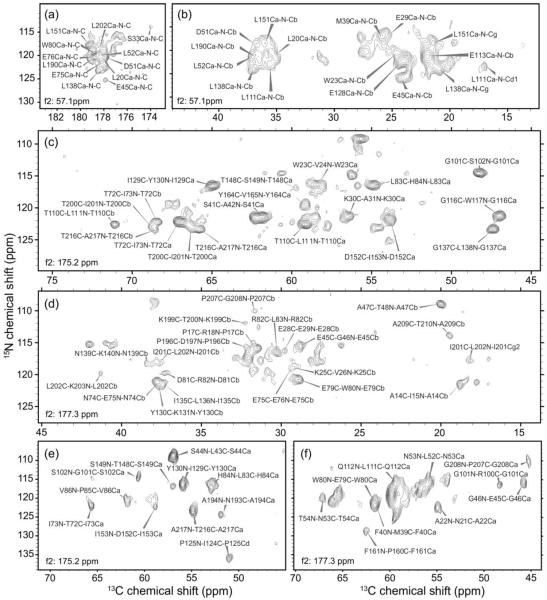
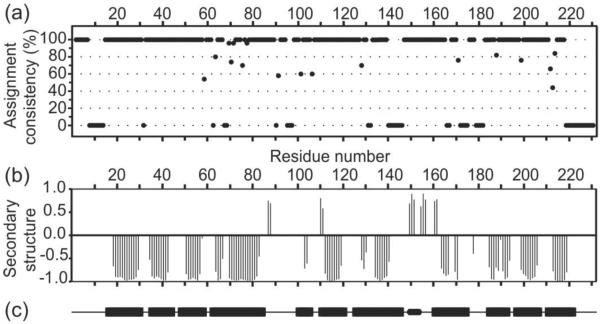
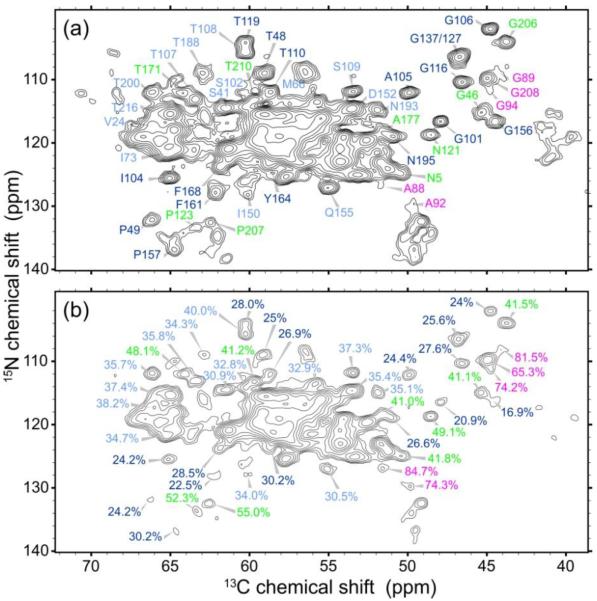
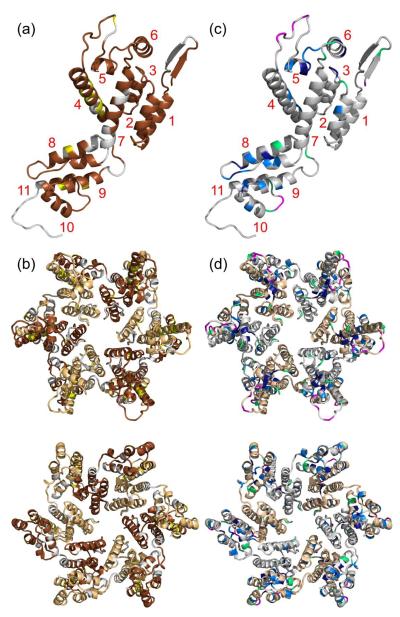
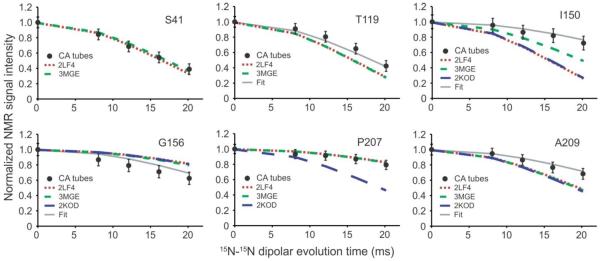
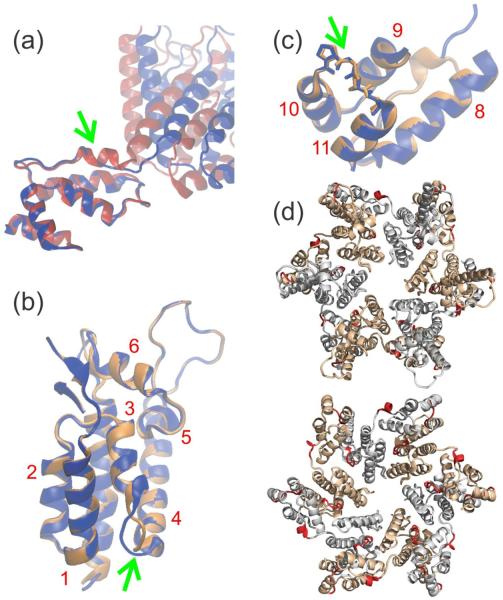
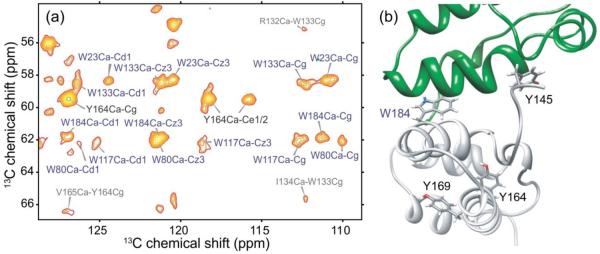
The 231-residue capsid (CA) protein of human immunodeficiency virus type 1 (HIV-1) spontaneously self-assembles into tubes with a hexagonal lattice that is believed to mimic the surface lattice of conical capsid cores within intact virions. We report the results of solid-state nuclear magnetic resonance (NMR) measurements on HIV-1 CA tubes that provide new information regarding changes in molecular structure that accompany CA self-assembly, local dynamics within CA tubes, and possible mechanisms for the generation of lattice curvature. This information is contained in site-specific assignments of signals in two- and three-dimensional solid-state NMR spectra, conformation-dependent (15)N and (13)C NMR chemical shifts, detection of highly dynamic residues under solution NMR conditions, measurements of local variations in transverse spin relaxation rates of amide (1)H nuclei, and quantitative measurements of site-specific (15)N-(15)N dipole-dipole couplings. Our data show that most of the CA sequence is conformationally ordered and relatively rigid in tubular assemblies and that structures of the N-terminal domain (NTD) and the C-terminal domain (CTD) observed in solution are largely retained. However, specific segments, including the N-terminal β-hairpin, the cyclophilin A binding loop, the inter-domain linker, segments involved in intermolecular NTD-CTD interactions, and the C-terminal tail, have substantial static or dynamical disorder in tubular assemblies. Other segments, including the 310-helical segment in CTD, undergo clear conformational changes. Structural variations associated with curvature of the CA lattice appear to be localized in the inter-domain linker and intermolecular NTD-CTD interface, while structural variations within NTD hexamers, around local 3-fold symmetry axes, and in CTD-CTD dimerization interfaces are less significant.

Keywords: AIDS; automated resonance assignment; electron microscopy; human immunodeficiency virus; solid-state NMR.


Figures

Figure 1
Figure 1
Characterization of HIV-1 CA tubes by electron microscopy and solid state NMR. (a,b) TEM images of negatively stained CA tubes. (c) 2D NCACX solid state NMR spectrum of U-CA tubes, showing only the region that contains 15N-13Cα crosspeaks. (d,e,f) Aliphatic regions of 2D 13C-13C MAS NMR spectra of U-CA, 2-CA, and 1,3-CA tubes, respectively, with 4.0 ms RFDR mixing periods. All 2D spectra were obtained at 14.1 T with MAS at 12.00 kHz. Contour levels increase by successive factors of 1.5.
Figure 2
Figure 2
Representative 2D planes from 3D solid state NMR spectra. (a) 15N-13CO region of a f1/f3 plane from a 3D NCACX spectrum of U-CA tubes, recorded at 21.1 T, with f2 =57.1 ppm. (b) Part of the aliphatic region of a f1/f3 plane from a 3D NCACX spectrum of U-CA tubes, recorded at 14.1 T, with f2 = 57.1 ppm. (c,d) Parts of the aliphatic regions of f1/f3 planes from a 3D NCOCX spectrum of U-CA tubes, recorded at 21.1 T, with f2 = 175.2 ppm and f2 = 177.3 ppm. (e,f) Parts of the aliphatic regions of f1/f3 planes from a 3D CONCA spectrum of 2-CA tubes, recorded at 14.1 T, with f2 = 175.2 ppm and f2 = 177.3 ppm. (Here f1, f2, and f3 refer to NMR frequencies in the first, second, and third dimensions of a 3D spectrum.)
Figure 3
Figure 3
Summary of signal assignments from solid state NMR spectra of CA tubes. (a) Assignment consistency in the 50 final MCASSIGN2 runs, with 100% consistency indicating unambiguous assignment of signals to a given residue and 0% consistency indicating a complete absence of signal assignments to a given residue. (b) Secondary structure predictions from TALOS+ based on solid state NMR chemical shifts, where negative values indicate helical backbone conformations and positive values indicate extended conformations. (c) Secondary structure elements in CA structures from solution NMR and X-ray crystallography. Rectangular bars indicate the 11 α-helical segments. The small rounded bar indicates the 310-helix (residues 149–152) between NTD and CTD.
Figure 4
Figure 4
Evidence for partial mobility at specific residues in HIV-1 CA tubes. (a) Reference 2D NCA spectrum, with zero 1H spin echo time. Crosspeaks are labeled with their residue-specific assignments. (b) 1H T2-filtered NCA spectrum, with a 168 μs 1H spin echo time. Crosspeaks are labeled with their amplitudes relative to the reference spectrum. Dark blue, light blue, green, and magenta labels corresponding to values of 15–30%, 31–40%, 41–55%, and 56–85%, respectively, with higher percentages corresponding to greater mobility.
Figure 5
Figure 5
Summary of information concerning local order and dynamics. (a) Cartoon representation of a CA monomer (from PDB code 2LF4) with unambiguously assigned residues in brown and tentatively assigned residues in yellow. Residues in gray have assignment consistencies below 80%, including residues to which solid state NMR signals are never assigned. Helical segments of CA are labeled in red. According to solid state NMR data, the 310-helix, between helices 7 and 8, is not present in our CA tubes. (b) CA hexamer (from PDB code 3GV2) with the same coloring as in panel a, except that dark brown and light brown are used for alternate CA molecules. The hexamer is viewed from outside a CA tube (top) and from inside a CA tube (bottom). (c) CA monomer with residues colored according to percentages in Figure 4b, with dark blue, light blue, green, and magenta corresponding to values of 15–30%, 31–40%, 41–55%, and 56–85%, respectively. Residues whose crosspeak signals are insufficiently resolved in the 1H T2-filtered NCA spectra are gray. (d) CA hexamer with the same coloring as in panel c, except that gray and light brown are used for alternate CA molecules. The hexamer is viewed from outside a CA tube (top) and from inside a CA tube (bottom).
Figure 6
Figure 6
Quantitative restraints on backbone conformation in HIV-1 CA tubes. 15N-BARE signal decay curves for the indicated residues are shown as filled circles, normalized to the signal amplitude at zero evolution time and with error bars representing root-mean-squared uncertainty due to noise in the experimental solid state NMR spectra. These curves are measurements of sequential amide 15N-15N distances, which are conformation-dependent. Dashed and dotted lines are simulations based on a CA monomer structure from solution NMR (red dots, PDB code 2LF4), a crystal structure of cross-linked CA hexamers (short green dashes, PDB code 3MGE), and a solution NMR structure of CTD dimers (long blue dashes, PDB code 2KOD). Simulations based on the refined structure in Figure 7a and 7b are shown in solid gray lines (“Fit”). See Figure S5 for examples of 2D spectra from which the 15N-BARE curves are extracted and Figure S6 for additional 15N-BARE curves.
Figure 7
Figure 7
Changes in published CA structures required to fit solid state NMR restraints on the CA structure within tubular assemblies. (a) Comparison of initial (red) and final (blue) structures, with optimal superposition of CTD segments, from a restrained molecular dynamics/simulated annealing calculation that used a CA monomer structure from solid state NMR (PDB code 2LF4) as the initial structure. The 310-helix near the NTD-CTD linker in the initial structure, indicated by the green arrow, changes to an extended conformation in order to accommodate solid state NMR chemical shift and 15N-BARE data. (b,c) Comparison of initial (orange) and final (blue) structures from a calculation that used a CA hexamer structure from X-ray crystallography (PDB code 3MGE) as the initial structure. Either NTD (helices 1–7) or CTD (helices 8–11) segments are optimally superposed. Green arrows indicate conformational changes between helices 3 and 4 (near the intermolecular NTD-CTD interface in a CA hexamer) and helices 10 and 11 (near the local three-fold axis in a CA lattice). Helical segments of CA are labeled in red. (d) CA hexamer (from PDB code 3GV2) with segments that exhibit conformational changes colored red. The hexamer is viewed from outside a CA tube (top) and from inside a CA tube (bottom). Segments in which conformational changes are not identified by our data are gray and light brown in alternate CA molecules.
Figure 8
Figure 8
Conformationally ordered aromatic sidechains in HIV-1 CA tubes. (a) Aromatic-aliphatic region of 2D 13C-13C spectrum of 2-CA tubes, acquired at 14.1 T with a 500 ms DARR mixing period and MAS at 12.00 kHz. Crosspeaks arising from Trp and Tyr residues are labeled in blue and black, respectively. Additional peaks are labeled in gray. (b) CTD dimer structure (PDB code 2KOD), highlighting the positions of tryptophan and tyrosine residues in one of the subunits. Trp184 adopts a well-defined, relatively rigid conformation in CA tubes, as indicated by its strong, sharp crosspeak signals, while Tyr164 is the only tyrosine residue with observable sidechain crosspeaks.

References

    1. Briggs JAG, Krausslich HG. The molecular architecture of HIV. J. Mol. Biol. 2011;410:491–500. - PubMed
    1. Engelman A, Cherepanov P. The structural biology of HIV-1: Mechanistic and therapeutic insights. Nat. Rev. Microbiol. 2012;10:279–290. - PMC - PubMed
    1. Gamble TR, Vajdos FF, Yoo SH, Worthylake DK, Houseweart M, Sundquist WI, Hill CP. Crystal structure of human cyclophilin A bound to the amino-terminal domain of HIV-1 capsid. Cell. 1996;87:1285–1294. - PubMed
    1. Momany C, Kovari LC, Prongay AJ, Keller W, Gitti RK, Lee BM, Gorbalenya AE, Tong L, McClure J, Ehrlich LS, Summers MF, Carter C, Rossmann MG. Crystal structure of dimeric HIV-1 capsid protein. Nat. Struct. Biol. 1996;3:763–770. - PubMed
    1. Gamble TR, Yoo SH, Vajdos FF, vonSchwedler UK, Worthylake DK, Wang H, McCutcheon JP, Sundquist WI, Hill CP. Structure of the carboxyl-terminal dimerization domain of the HIV-1 capsid protein. Science. 1997;278:849–853. - PubMed

Publication types

Substances

LinkOut - more resources