

Radiation doses of cerebral blood volume measurements using C-arm CT: A phantom study
- PMID: 24371024
- PMCID: PMC7965136
- DOI: 10.3174/ajnr.A3822
Radiation doses of cerebral blood volume measurements using C-arm CT: A phantom study
Abstract
Background and purpose: Parenchymal blood volume measurement by C-arm CT facilitates in-room peritherapeutic perfusion evaluation. However, the radiation dose remains a major concern. This study aimed to compare the radiation dose of parenchymal blood volume measurement using C-arm CT with that of conventional CTP using multidetector CT.
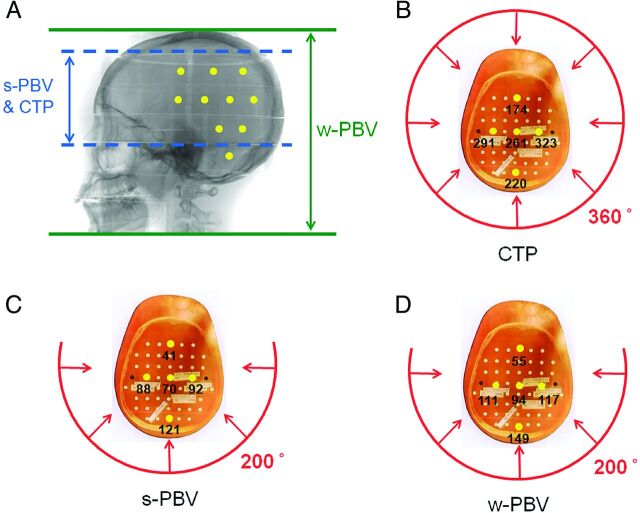
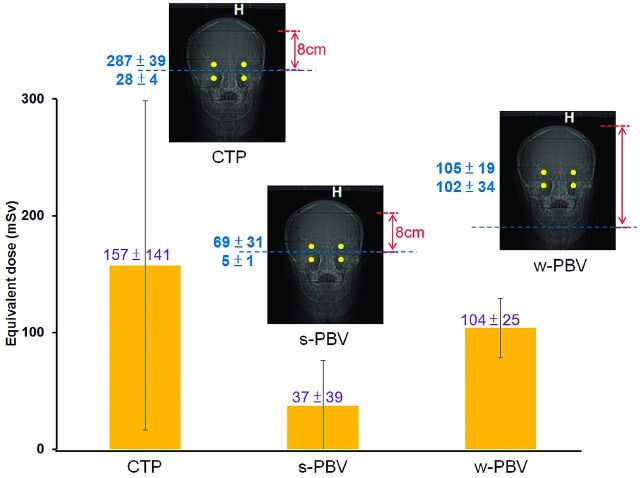
Materials and methods: A biplane DSA equipped with C-arm CT and a Rando-Alderson phantom were used. Slab parenchymal blood volume (8-cm scanning range in a craniocaudal direction) and whole-brain parenchymal blood volume with identical scanning parameters, except for scanning ranges, were undertaken on DSA. Eighty thermoluminescent dosimeters were embedded into 22 organ sites of the phantom. We followed the guidelines of the International Commission on Radiation Protection number 103 to calculate the effective doses. For comparison, 8-cm CTP with the same phantom and thermoluminescent dosimeter distribution was performed on a multidetector CT. Two repeat dose experiments with the same scanning parameters and phantom and thermoluminescent dosimeter settings were conducted.
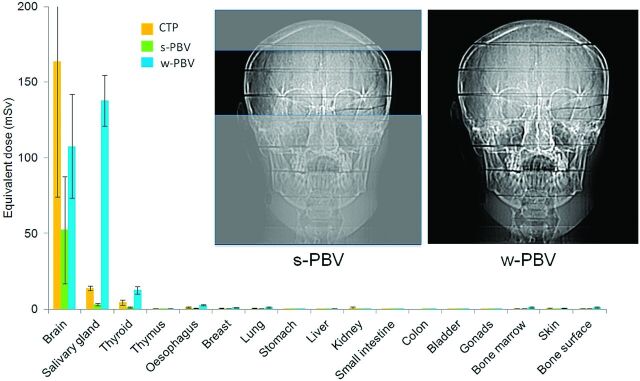
Results: Brain-equivalent dose in slab parenchymal blood volume, whole-brain parenchymal blood volume, and CTP were 52.29 ± 35.31, 107.51 ± 31.20, and 163.55 ± 89.45 mSv, respectively. Variations in the measurement of an equivalent dose for the lens were highest in slab parenchymal blood volume (64.5%), followed by CTP (54.6%) and whole-brain parenchymal blood volume (29.0%). The effective doses of slab parenchymal blood volume, whole-brain parenchymal blood volume, and CTP were 0.87 ± 0.55, 3.91 ± 0.78, and 2.77 ± 1.59 mSv, respectively.
Conclusions: The dose measurement conducted in the current study was reliable and reproducible. The effective dose of slab parenchymal blood volume is about one-third that of CTP. With the advantages of on-site and immediate imaging availability and saving procedural time and patient transportation, slab parenchymal blood volume measurement using C-arm CT can be recommended for clinical application.
© 2014 by American Journal of Neuroradiology.
Figures
References
-
- Konstas AA, Wintermark M, Lev MH. CT perfusion imaging in acute stroke. Neuroimaging Clin N Am 2011;21:215–38, ix - PubMed
-
- Waaijer A, van Leeuwen MS, van Osch MJ, et al. Changes in cerebral perfusion after revascularization of symptomatic carotid artery stenosis: CT measurement. Radiology 2007;245:541–48 - PubMed
-
- Xue J, Gao P, Wang X, et al. Ischemic lesion typing on computed tomography perfusion and computed tomography angiography in hyperacute ischemic stroke: a preliminary study. Neurol Res 2008;30:337–40 - PubMed
Publication types
MeSH terms
LinkOut - more resources
Full Text Sources
Other Literature Sources