. 2014 Mar;55(3):561-72.
doi: 10.1194/jlr.P040501. Epub 2013 Dec 26.

Altered renal lipid metabolism and renal lipid accumulation in human diabetic nephropathy

Affiliations

Altered renal lipid metabolism and renal lipid accumulation in human diabetic nephropathy

Michal Herman-Edelstein et al. J Lipid Res. 2014 Mar.

Abstract

Animal models link ectopic lipid accumulation to renal dysfunction, but whether this process occurs in the human kidney is uncertain. To this end, we investigated whether altered renal TG and cholesterol metabolism results in lipid accumulation in human diabetic nephropathy (DN). Lipid staining and the expression of lipid metabolism genes were studied in kidney biopsies of patients with diagnosed DN (n = 34), and compared with normal kidneys (n = 12). We observed heavy lipid deposition and increased intracellular lipid droplets. Lipid deposition was associated with dysregulation of lipid metabolism genes. Fatty acid β-oxidation pathways including PPAR-α, carnitine palmitoyltransferase 1, acyl-CoA oxidase, and L-FABP were downregulated. Downregulation of renal lipoprotein lipase, which hydrolyzes circulating TGs, was associated with increased expression of angiopoietin-like protein 4. Cholesterol uptake receptor expression, including LDL receptors, oxidized LDL receptors, and acetylated LDL receptors, was significantly increased, while there was downregulation of genes effecting cholesterol efflux, including ABCA1, ABCG1, and apoE. There was a highly significant correlation between glomerular filtration rate, inflammation, and lipid metabolism genes, supporting a possible role of abnormal lipid metabolism in the pathogenesis of DN. These data suggest that renal lipid metabolism may serve as a target for specific therapies aimed at slowing the progression of glomerulosclerosis.

Keywords: cholesterol metabolism; lipid droplets; lipotoxicity.


Figures
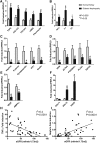
Fig. 1.
Fig. 1.
A: Fibrotic genes: TGFβ, collagen 1, collagen 3, and fibronectin. B: Inflammatory and oxidative genes: TNFα, IL1, and IL6. C, D: Altered podocyte-specific genes in DN: nephrin, podocin, synaptopodin, WT1, nestin, dendrin (DDN), α-actinin-4 gene (ACTN4), podoxal, phospholipase C epsilon (PLCE1), and transient receptor potential-6 (TRPC6). E, F: Other genes representing DN: VEGF, AMP-activated protein kinase (AMPKα), sodium-glucose cotransporter 1 (SGLT1), SGLT2, and receptor for advanced glycation endproducts (RAGE). H: Correlations between the eGFR and expression of TNFα. I: Correlations between the eGFR and expression of nephrin. Representative results are presented as mean ± SEM. *P < 0.05, #P < 0.005 DN versus normal kidney.
Fig. 2.
Fig. 2.
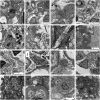
a: EM of glomeruli overloaded with LDs. a–c: Note LDs in podocytes in DN. PC, podocyte cell; FP, foot processes. c: Note cluster of LDs in podocyte foot processes. g: LDs in glomerular fenestrated endothelial cell, collagen fibrils can be seen. h: LDs in mesangial cells. e, f: Epithelial cell of the proximal tubule showing cell injury, resulting microvilli, lost swollen mitochondria, and LDs. e: Lysosome (L) or mitochondria (M) can be differentiated from LDs. d: LD in early DN where podocyte foot processes are still preserved (Cap, capillary loop) and in advanced fibrotic glomerulosclerotic lesion (D) in obesity related glomerulophathy (ORG). n: LD in podocyte with severe widening of glomerular basement membrane (GBM).
Fig. 3.
Fig. 3.
Increased lipid accumulation in DN, representative pictures of lipid staining. A: Oil Red O staining of frozen kidney sections (glomeruli; 40× magnification). Representative photomicrographs of the Oil Red O-stained glomerular and tubulointerstitial regions of the kidney in biopsy with DN. B: Representative photo of BODIPY staining and Filipin cholesterol staining in DN kidney. C: Representative immunofluorescent photo of adipophilin (ADRP) control, early DN, and advanced DN (40× magnification). D: qRT-PCR analysis of ADRP (PRLIN2). Representative qRT-PCR results are the mean ± SEM; *P < 0.05 versus normal kidney.
Fig. 4.
Fig. 4.
Genes in TG metabolism. A: qRT-PCR analysis genes involved in lipogenesis (SREBP-1c, ChREBP, ACC, FAS, SCD1); glycolysis (L-PK); and TG synthesis (DGAT1). B: qRT-PCR analysis genes involved in TG metabolism and extracellular lipolysis (LPL and Angpt4). C: qRT-PCR analysis genes involved in fat uptake (CD36); and β-oxidation and FA export (PPARα, PPARδ, CPT1, ACO, and L-FABP). Representative qRT-PCR results are the mean ± SEM. *P < 0.05, #P < 0.005 DN versus normal kidney.
Fig. 5.
Fig. 5.
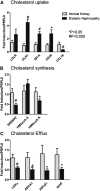
Genes in cholesterol metabolism. A: qRT-PCR analysis genes involved in cholesterol uptake (LDLR, oxLDLR, acLDLR, CD36, and CCL16). B: qRT-PCR analysis genes involved in cholesterol synthesis (SREBP-2, HmgCOA R, and HmgCOA S). C: Cholesterol efflux transporters [liver X receptor (LXR)α, ABCA1, ABCG1, and apoE]. Representative qRT-PCR results are the mean ± SEM. *P < 0.05, #P < 0.005 DN versus normal kidney.
Fig. 6.
Fig. 6.
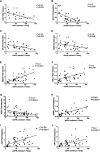
Correlations between the eGFR and expression of different genes in lipid metabolism: LDLR (n = 35) (A); LOX-1 (OLR-1) (n = 44) (B); SR-A (n = 56) (C); CD36 (N = 48) (D); ABCG1 (n = 54) (E); ABCA1 (n = 51) (F); SCD1 (n = 48) (G); PPARα (n = 52) (H); ACO (n = 49) (I); and CPT1a (n = 45) (J). Filled circles represent individual patients.
Fig. 7.
Fig. 7.
Lipid metabolism in the kidney. Intracellular lipid accumulation is governed by a balance between the influx, syntheses, and oxidation or efflux of TGs and cholesterol. In this cartoon, we illustrate lipid metabolism. Our results provide insights into the expression of key genes of lipid metabolism in the DN human kidney compared with a normal kidney. Arrows represent changes that we showed in DN.

References

    1. Rutledge J. C., Ng K. F., Aung H. H., Wilson D. W. 2010. Role of triglyceride-rich lipoproteins in diabetic nephropathy. Nat. Rev. Nephrol. 6: 361–370 - PubMed
    1. Cooper M. E., Jandeleit-Dahm K. A. 2005. Lipids and diabetic renal disease. Curr. Diab. Rep. 5: 445–448 - PubMed
    1. Schulze P. C. 2009. Myocardial lipid accumulation and lipotoxicity in heart failure. J. Lipid Res. 50: 2137–2138 - PMC - PubMed
    1. Li W. Y., Yao C. X., Zhang S. F., Wang S. L., Wang T. Q., Xiong C. J., Li Y. B., Zang M. X. 2012. Improvement of myocardial lipid accumulation and prevention of PGC-1α induction by fenofibrate. Mol. Med. Rep. 5: 1396–1400 - PubMed
    1. Marfella R., Di Filippo C., Portoghese M., Barbieri M., Ferraraccio F., Siniscalchi M., Cacciapuoti F., Rossi F., D'Amico M., Paolisso G. 2009. Myocardial lipid accumulation in patients with pressure-overloaded heart and metabolic syndrome. J. Lipid Res. 50: 2314–2323 - PMC - PubMed

Publication types

MeSH terms