

Single molecule analysis of Thermus thermophilus SSB protein dynamics on single-stranded DNA
- PMID: 24371279
- PMCID: PMC3973332
- DOI: 10.1093/nar/gkt1316
Single molecule analysis of Thermus thermophilus SSB protein dynamics on single-stranded DNA
Abstract
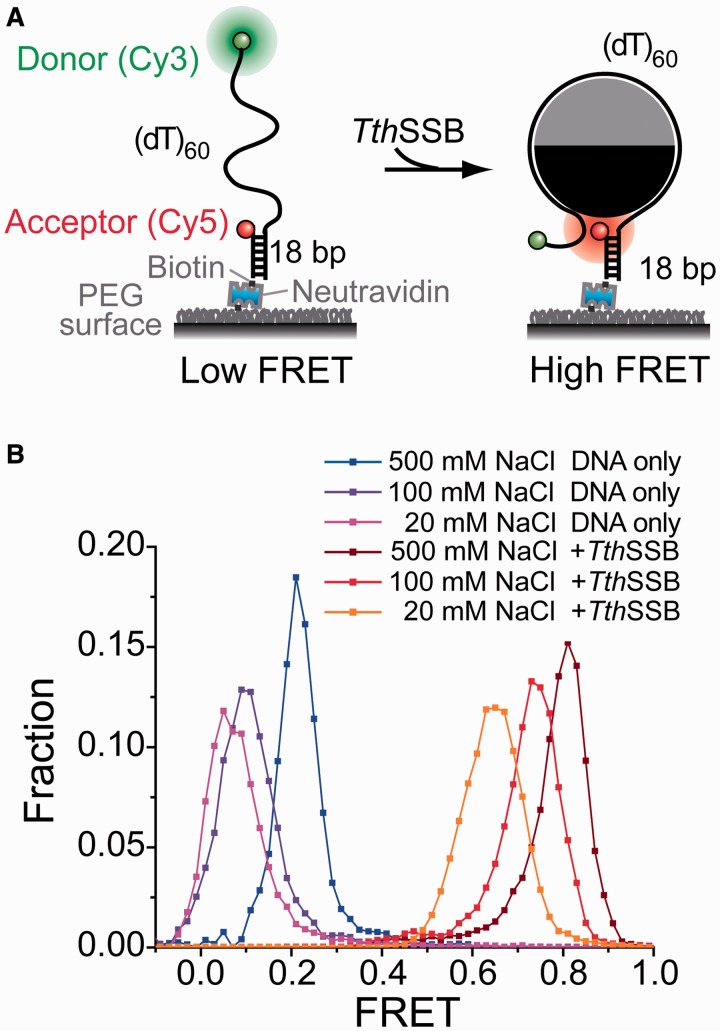
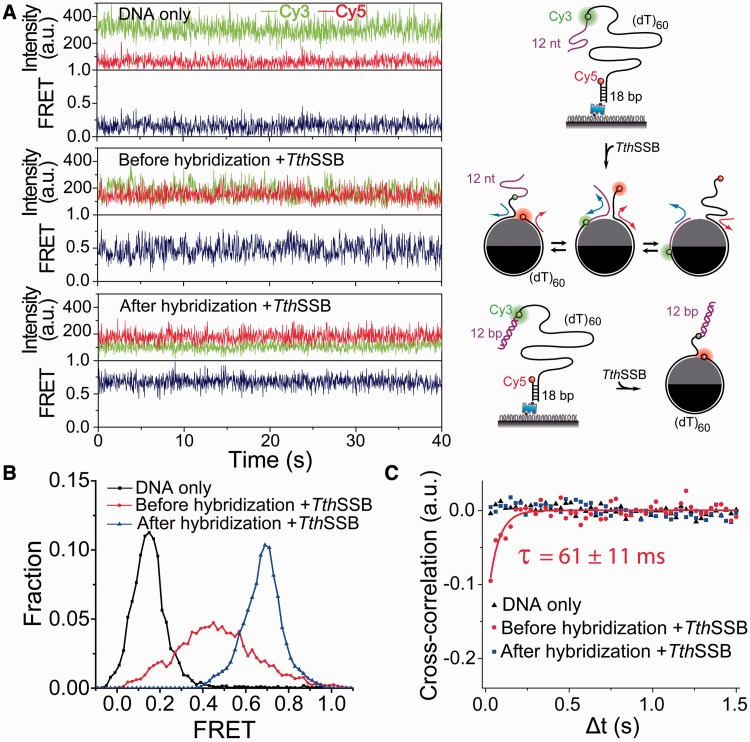
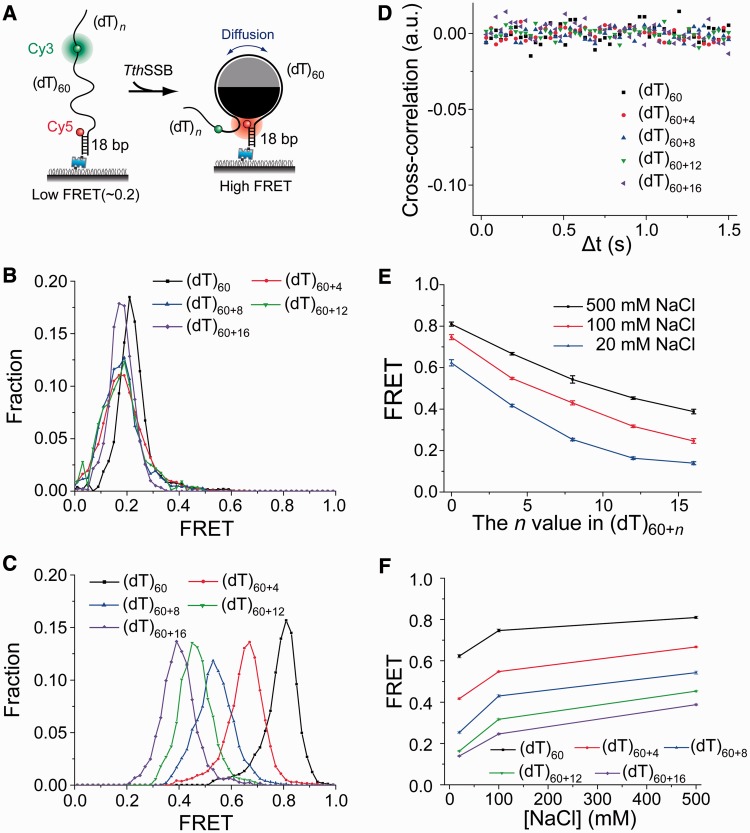
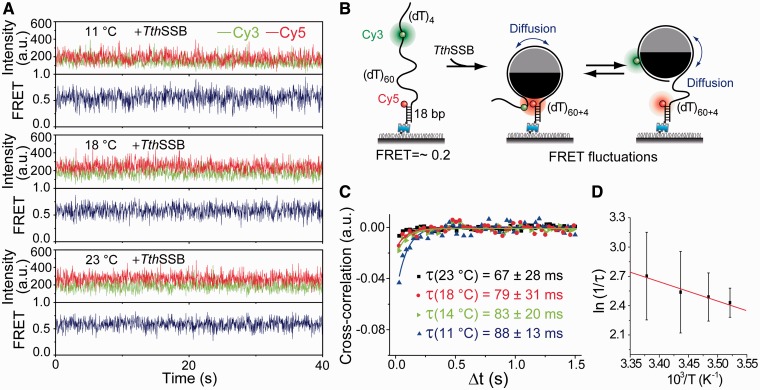
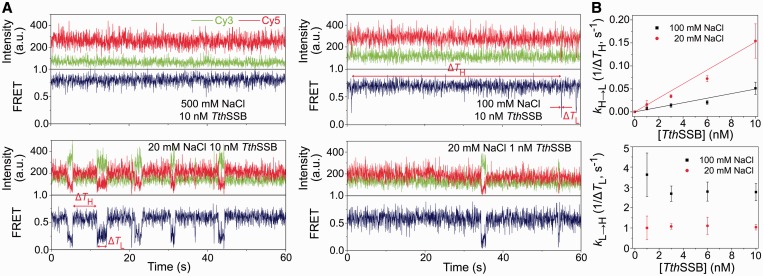
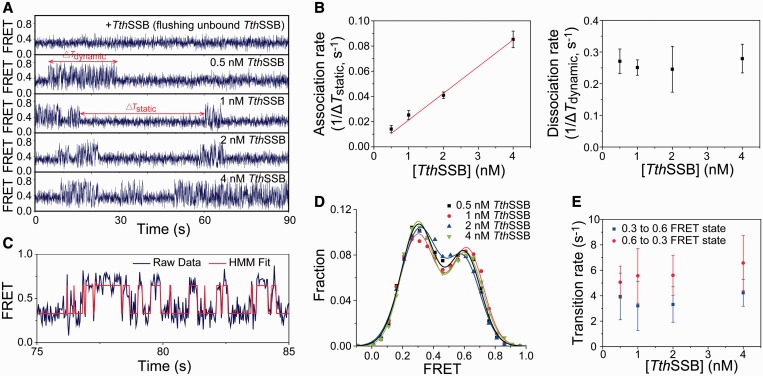
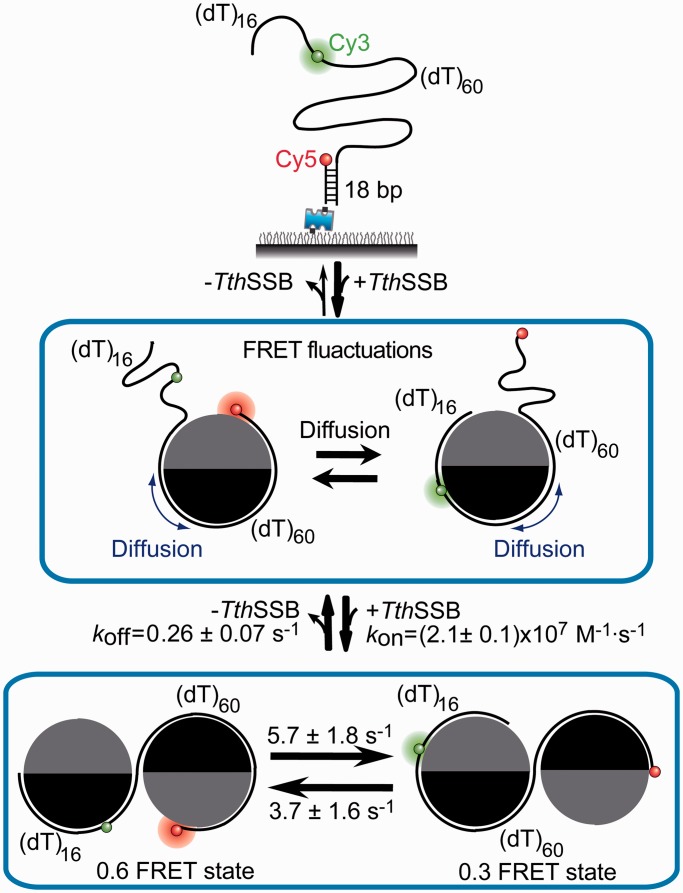
Single-stranded (ss) DNA binding (SSB) proteins play central roles in DNA replication, recombination and repair in all organisms. We previously showed that Escherichia coli (Eco) SSB, a homotetrameric bacterial SSB, undergoes not only rapid ssDNA-binding mode transitions but also one-dimensional diffusion (or migration) while remaining bound to ssDNA. Whereas the majority of bacterial SSB family members function as homotetramers, dimeric SSB proteins were recently discovered in a distinct bacterial lineage of extremophiles, the Thermus-Deinococcus group. Here we show, using single-molecule fluorescence resonance energy transfer (FRET), that homodimeric bacterial SSB from Thermus thermophilus (Tth) is able to diffuse spontaneously along ssDNA over a wide range of salt concentrations (20-500 mM NaCl), and that TthSSB diffusion can help transiently melt the DNA hairpin structures. Furthermore, we show that two TthSSB molecules undergo transitions among different DNA-binding modes while remaining bound to ssDNA. Our results extend our previous observations on homotetrameric SSBs to homodimeric SSBs, indicating that the dynamic features may be shared among different types of SSB proteins. These dynamic features of SSBs may facilitate SSB redistribution and removal on/from ssDNA, and help recruit other SSB-interacting proteins onto ssDNA for subsequent DNA processing in DNA replication, recombination and repair.
Figures

Similar articles
-
Novel thermostable ssDNA-binding proteins from Thermus thermophilus and T. aquaticus-expression and purification.Protein Expr Purif. 2002 Oct;26(1):131-8. doi: 10.1016/s1046-5928(02)00504-1. Protein Expr Purif. 2002. PMID: 12356480
-
Chemo-mechanical pushing of proteins along single-stranded DNA.Proc Natl Acad Sci U S A. 2016 May 31;113(22):6194-9. doi: 10.1073/pnas.1602878113. Epub 2016 May 16. Proc Natl Acad Sci U S A. 2016. PMID: 27185951 Free PMC article.
-
Single-molecule analysis of SSB dynamics on single-stranded DNA.Methods Mol Biol. 2012;922:85-100. doi: 10.1007/978-1-62703-032-8_5. Methods Mol Biol. 2012. PMID: 22976178
-
Escherichia coli single-stranded DNA-binding protein: multiple DNA-binding modes and cooperativities.Annu Rev Biochem. 1994;63:527-70. doi: 10.1146/annurev.bi.63.070194.002523. Annu Rev Biochem. 1994. PMID: 7979247 Review.
-
Unravelling How Single-Stranded DNA Binding Protein Coordinates DNA Metabolism Using Single-Molecule Approaches.Int J Mol Sci. 2023 Feb 1;24(3):2806. doi: 10.3390/ijms24032806. Int J Mol Sci. 2023. PMID: 36769124 Free PMC article. Review.
Cited by
-
A real-time fluorescent gp32 probe-based assay for monitoring single-stranded DNA-dependent DNA processing enzymes.Biochem Biophys Rep. 2023 Jul 22;35:101518. doi: 10.1016/j.bbrep.2023.101518. eCollection 2023 Sep. Biochem Biophys Rep. 2023. PMID: 37534323 Free PMC article.
-
Dynamic structural insights into the molecular mechanism of DNA unwinding by the bacteriophage T7 helicase.Nucleic Acids Res. 2020 Apr 6;48(6):3156-3164. doi: 10.1093/nar/gkaa057. Nucleic Acids Res. 2020. PMID: 32009150 Free PMC article.
-
Effects of Conserved Wedge Domain Residues on DNA Binding Activity of Deinococcus radiodurans RecG Helicase.Front Genet. 2021 Feb 4;12:634615. doi: 10.3389/fgene.2021.634615. eCollection 2021. Front Genet. 2021. PMID: 33613647 Free PMC article.
-
Biosensors for Detection of Human Placental Pathologies: A Review of Emerging Technologies and Current Trends.Transl Res. 2019 Nov;213:23-49. doi: 10.1016/j.trsl.2019.05.002. Epub 2019 May 20. Transl Res. 2019. PMID: 31170377 Free PMC article. Review.
-
A New Small and Resilient Nucleic Acid-Binding Protein from Nanoarchaeum equitans.Mol Biotechnol. 2025 Jun 30. doi: 10.1007/s12033-025-01458-w. Online ahead of print. Mol Biotechnol. 2025. PMID: 40586830
References
-
- Lohman TM, Ferrari ME. Escherichia coli single-stranded DNA-binding protein: multiple DNA-binding modes and cooperativities. Annu. Rev. Biochem. 1994;63:527–570. - PubMed
-
- Wold MS. Replication protein A: a heterotrimeric, single-stranded DNA-binding protein required for eukaryotic DNA metabolism. Annu. Rev. Biochem. 1997;66:61–92. - PubMed
-
- Richard DJ, Bolderson E, Khanna KK. Multiple human single-stranded DNA binding proteins function in genome maintenance: structural, biochemical and functional analysis. Crit. Rev. Biochem. Mol. Biol. 2009;44:98–116. - PubMed
Publication types
MeSH terms
Substances
Grants and funding
LinkOut - more resources
Full Text Sources
Other Literature Sources
