. 2014 Jun 15;111(12):2393-403.
doi: 10.1152/jn.00332.2013. Epub 2013 Dec 26.

Visual and vestibular perceptual thresholds each demonstrate better precision at specific frequencies and also exhibit optimal integration

Affiliations

Visual and vestibular perceptual thresholds each demonstrate better precision at specific frequencies and also exhibit optimal integration

Faisal Karmali et al. J Neurophysiol. .

Abstract

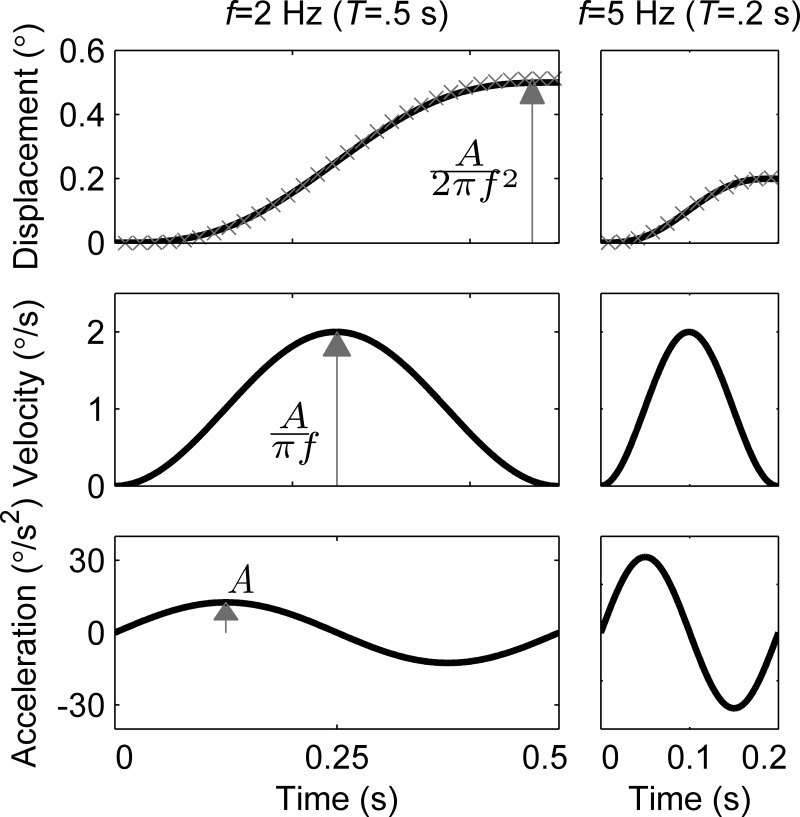
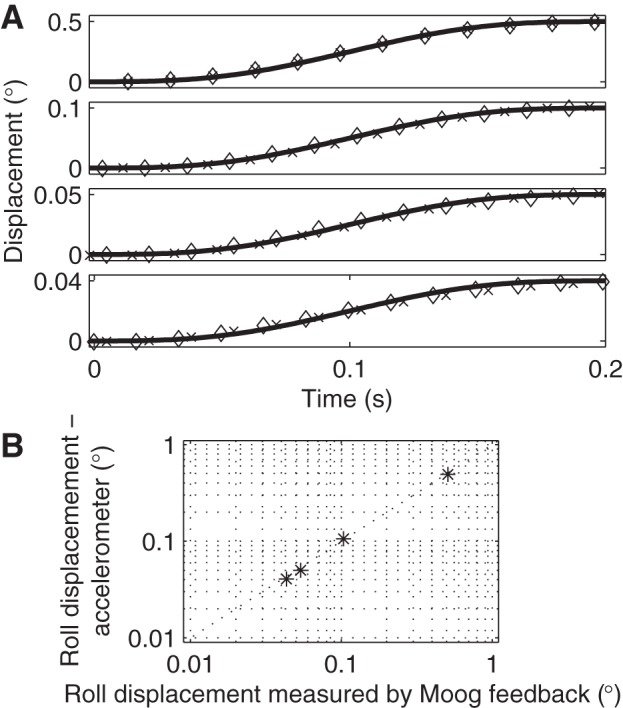
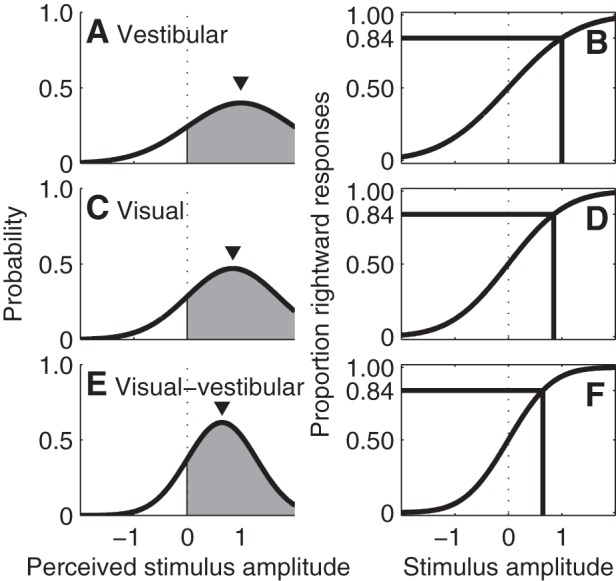
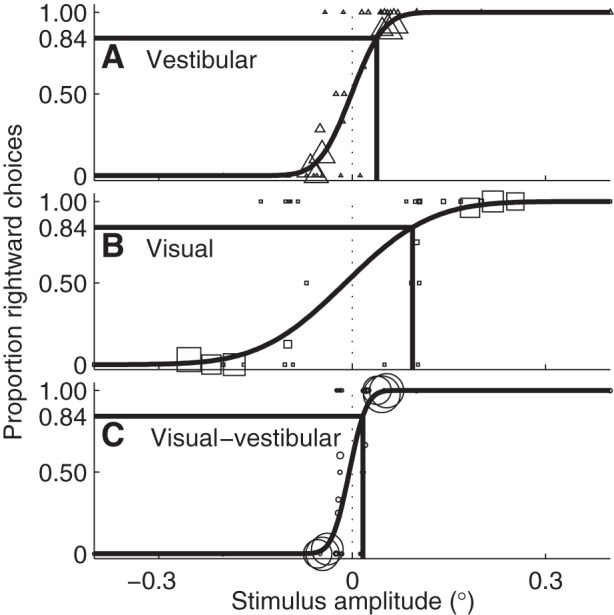
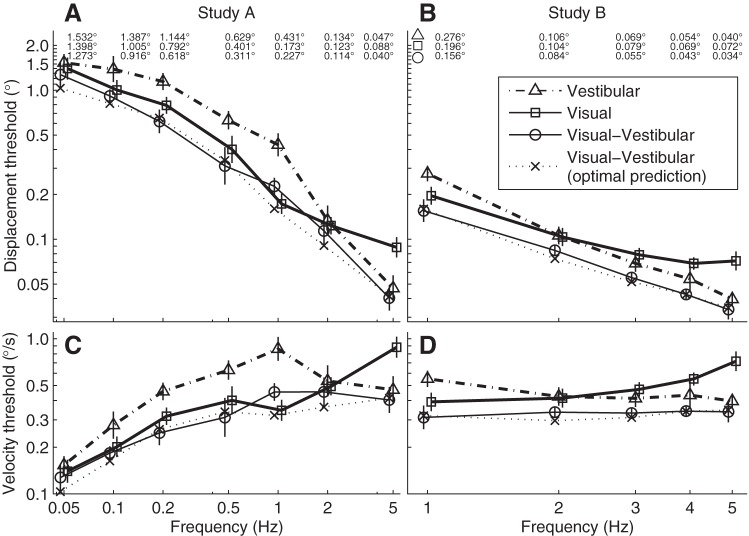
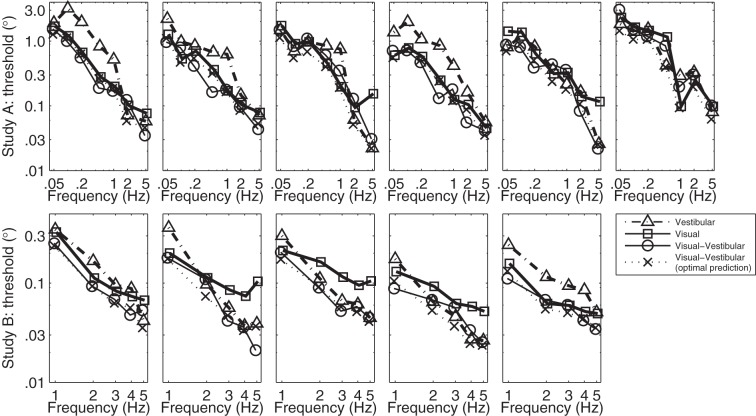
Prior studies show that visual motion perception is more precise than vestibular motion perception, but it is unclear whether this is universal or the result of specific experimental conditions. We compared visual and vestibular motion precision over a broad range of temporal frequencies by measuring thresholds for vestibular (subject motion in the dark), visual (visual scene motion) or visual-vestibular (subject motion in the light) stimuli. Specifically, thresholds were measured for motion frequencies spanning a two-decade physiological range (0.05-5 Hz) using single-cycle sinusoidal acceleration roll tilt trajectories (i.e., distinguishing left-side down from right-side down). We found that, while visual and vestibular thresholds were broadly similar between 0.05 and 5.0 Hz, each cue is significantly more precise than the other at certain frequencies. Specifically, we found that 1) visual and vestibular thresholds were indistinguishable at 0.05 Hz and 2 Hz (i.e., similarly precise); 2) visual thresholds were lower (i.e., vision more precise) than vestibular thresholds between 0.1 Hz and 1 Hz; and 3) visual thresholds were higher (i.e., vision less precise) than vestibular thresholds above 2 Hz. This shows that vestibular perception can be more precise than visual perception at physiologically relevant frequencies. We also found that sensory integration of visual and vestibular information is consistent with static Bayesian optimal integration of visual-vestibular cues. In contrast with most prior work that degraded or altered sensory cues, we demonstrated static optimal integration using natural cues.

Keywords: human; otoliths; psychophysics; roll tilt; semicircular canals; vision.


Figures

Fig. 1.
Fig. 1.
A representation of the visual scene used for the “visual” and “visual-vestibular” conditions. The black circular aperture was precisely aligned with the roll rotation axis and placed close to the normal visual near point to help minimize the comparison of body-fixed and space-fixed visual cues. Small differences between the visual scenes in studies A and B are examined in detail in the discussion. The forest poster “Aspens, Ashley NF” is replicated with permission of photographer Alain Thomas.
Fig. 2.
Fig. 2.
Examples of ideal motion stimuli for 2 Hz and 5 Hz. Although both have the same peak velocity of 2°/s, they differ in peak velocity and acceleration (A). Actual device position (gray x) from a 60-Hz feedback signal closely matches the theoretical motion. f, frequency; T, period.
Fig. 3.
Fig. 3.
A: actual device position with (◇) and without (x) a human subject closely matches the theoretical motion (line) for various displacement magnitudes. Device position from a 60-Hz Moog position feedback signal is shown. Displacements of 0.04°, 0.05° and 0.10° are shown because they span the thresholds at 5 Hz for the three testing conditions, as well as the displacements for trials at fixed ratios (1.30, 1.55, 1.80) of an initial estimate of threshold. B: an accelerometer used to measure tilt verified that the Moog feedback signal accurately reported device displacement at 5 Hz for motions near threshold and larger.
Fig. 4.
Fig. 4.
Hypothetical relationships between noise and thresholds. A: vestibular noise has a standard deviation of 1.0, yielding the probability density function (PDF) showing the likely perceived stimulus given an actual stimulus amplitude (▼) of 1.0. The gray area shows the probability the brain will perceive the motion to be rightward (i.e., positive). In this example, the area is 84.1% because the stimulus amplitude equals the noise standard deviation. B: the psychometric function shows the probability that a subject will respond that the motion is rightward, which is equal to the gray area under the PDF when the PDF is centered at that stimulus amplitude. Lines show the threshold, i.e., the stimulus amplitude that leads to 84.1% correct responses, which occurs when the stimulus amplitude equals the noise standard deviation. In these examples no bias is assumed. C and D: PDF and psychometric function, respectively, for a visual input with a standard deviation of 0.85 and stimulus amplitude of 0.85, yielding a lower threshold than for vestibular inputs. E and F: PDF and psychometric function, respectively, for combined visual-vestibular stimulation, assuming that precision improves by having both cues together, which corresponds to a smaller standard deviation than individual cues. The smaller standard deviation corresponds to a narrower PDF and steeper psychometric function.
Fig. 5.
Fig. 5.
Example of psychometric curves from one subject at 5 Hz. A: the triangles represent the proportion of rightward choices at each stimulus amplitude with vestibular cues. The size of the symbols reflects the number of trials at that amplitude. The psychometric curve is fit to these data, and the black lines indicate the threshold, the place where the stimulus amplitude at which subjects will report rightward motion 84.1% of the time. B and C: the same fits for visual cues (□), and vestibular and visual cues (○), respectively.
Fig. 6.
Fig. 6.
The frequency response of roll tilt recognition thresholds for vestibular (△), visual (□) and visual-vestibular (○) cues. The predicted visual-vestibular threshold for static optimal integration of individual thresholds is also shown (x's). A and B: displacement thresholds from studies A and B, respectively. Each point is the geometric average across subjects (six in A, five in B), with the bars indicating standard error of the mean. While study A measured across 2 decades of frequency, study B focused on a narrow range of frequencies. For quantitative evaluation, vestibular, visual and visual-vestibular displacement thresholds are presented numerically along the top. Caution is required for direct comparisons of study A and B thresholds because they use different subjects and slightly different methods. C and D: the thresholds in peak velocity, which are most relevant at higher frequencies where velocity cues are more salient.
Fig. 7.
Fig. 7.
Field of view (FOV) above 30° shows little effect on visual thresholds. Although visual thresholds seem to be somewhat higher when FOV was much smaller (20°) than that used in our studies (63° in study A, 56° in study B, as indicated by arrows), none of the differences observed, nor the overall trend, are statistically significant. FOV was modified by changing the diameter of the circular aperture through which subjects viewed the visual scene, as demonstrated in the illustrations (a larger picture of the visual scene appears in Fig. 1). The visual scene was slightly closer in study B than study A, as shown by the larger forest poster size in the illustration, and thus 56° was not sampled for this FOV study. Subjects always viewed the scene binocularly. The stated FOV is for all areas that subjects could see, even if by only one eye, which became challenging at smaller diameters. At 20° FOV, the FOV with binocular coverage was between 3° and 6°, depending on the interpupilliary distance. Each point is the geometric average across four subjects, with the bars indicating standard error of the mean. The forest poster “Aspens, Ashley NF” is replicated with permission of photographer Alain Thomas.
Fig. 8.
Fig. 8.
Thresholds are lower when relative visual cues are provided in addition to absolute visual cues. We define relative cues as those in which the motion of space-fixed and body-fixed landmarks can be compared, while absolute cues only provide motion of the visual scene relative to the retina. Open circles are the same condition presented for visual-vestibular (study A) thresholds in which the circular aperture is used to prevent subjects from using relative visual cues. Solid circles are visual-vestibular thresholds for which the aperture was not used, allowing subjects to look for relative cues; for example, one subject reported using their knee as a landmark to judge motion of the visual scene. Averaged across frequencies, thresholds are 30% lower when relative cues are provided. Although the effect of relative visual cues could have been more directly assessed using visual thresholds rather than visual-vestibular thresholds, this was not possible because of the limited space to mount the visual scene on the motion device. While a possible confound is that FOV also increased without the aperture, this is unlikely because visual thresholds are relatively insensitive to FOV, especially above 30° (Fig. 7). Thresholds are geometric means of five subjects, with the bars indicating standard error of the mean.
Fig. 9.
Fig. 9.
The frequency responses of roll tilt recognition thresholds for individual subjects in studies A and B.
Fig. 10.
Fig. 10.
Roll tilt thresholds in the dark likely rely on the integration of semicircular canal (SCC) and otolith organ cues. Roll rotation thresholds (◇) are collected with the subject supine, so that the SCC are the primary motion cue. Pseudostatic-tilt thresholds (dashed line) are collected using very slow constant velocity tilts which stimulate primarily the otolith organ and are consistent with “otolith” thresholds determined by others (Janssen et al. 2011). At low frequencies, roll tilt thresholds are consistent with the pseudostatic-tilt threshold, suggesting the brain relies primarily on otolith organ cues. At high frequencies, roll tilt thresholds are consistent with roll rotation thresholds, suggesting that the brain relies primarily on SCC cues. At intermediate frequencies, roll tilt thresholds are lower than either roll rotation or pseudostatic-tilt thresholds, suggesting that the brain integrates cues to improve precision. (These control data were collected using subject 6 from study A.)

References

    1. Angelaki DE, Yakusheva TA. How vestibular neurons solve the tilt/translation ambiguity. Comparison of brainstem, cerebellum, and thalamus. Ann N Y Acad Sci 1164: 19–28, 2009 - PMC - PubMed
    1. Benson AJ, Hutt EC, Brown SF. Thresholds for the perception of whole body angular movement about a vertical axis. Aviat Space Environ Med 60: 205–213, 1989 - PubMed
    1. Benson AJ, Spencer MB, Stott JR. Thresholds for the detection of the direction of whole-body, linear movement in the horizontal plane. Aviat Space Environ Med 57: 1088–1096, 1986 - PubMed
    1. Bles W, Vianney de Jong JM, de Wit G. Compensation for labyrinthine defects examined by use of a tilting room. Acta Otolaryngol (Stockh) 95: 576–579, 1983 - PubMed
    1. Bockisch CJ, Haslwanter T. Three-dimensional eye position during static roll and pitch in humans. Vision Res 41: 2127–2137, 2001 - PubMed

Publication types

LinkOut - more resources