. 2013 Feb 2:8590:10.1117/12.2003187.
doi: 10.1117/12.2003187.

Single-molecule FRET experiments with a red-enhanced custom technology SPAD

Affiliations

Single-molecule FRET experiments with a red-enhanced custom technology SPAD

Francesco Panzeri et al. Proc SPIE Int Soc Opt Eng. .

Abstract

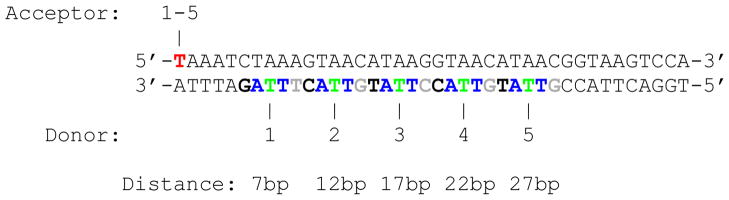
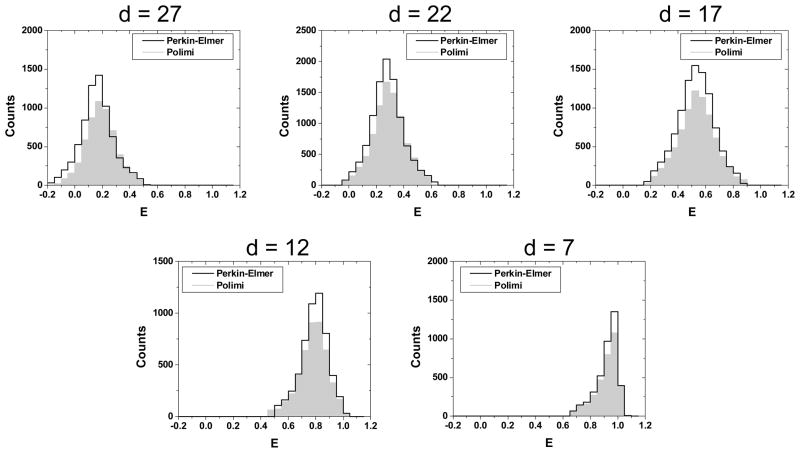
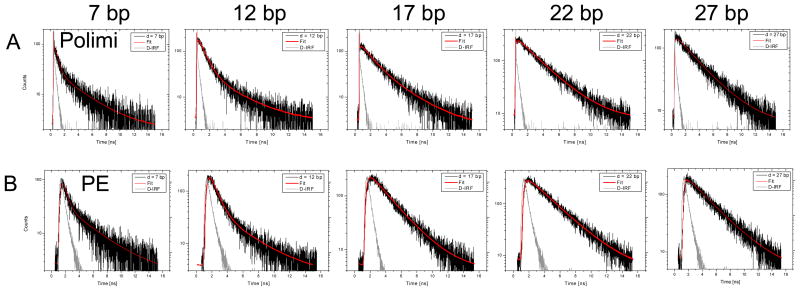
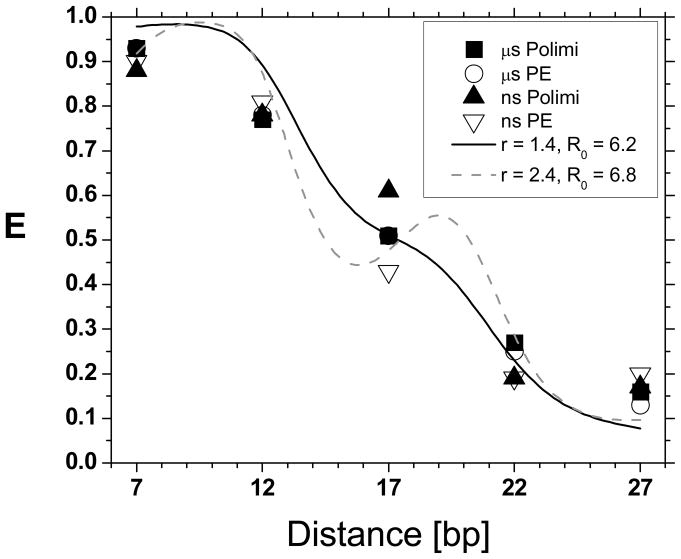
Single-molecule fluorescence spectroscopy of freely diffusing molecules in solution is a powerful tool used to investigate the properties of individual molecules. Single-Photon Avalanche Diodes (SPADs) are the detectors of choice for these applications. Recently a new type of SPAD detector was introduced, dubbed red-enhanced SPAD (RE-SPAD), with good sensitivity throughout the visible spectrum and with excellent timing performance. We report a characterization of this new detector for single-molecule fluorescence resonant energy transfer (smFRET) studies on freely diffusing molecules in a confocal geometry and alternating laser excitation (ALEX) scheme. We use a series of doubly-labeled DNA molecules with donor-to-acceptor distances covering the whole range of useful FRET values. Both intensity-based (μs-ALEX) and lifetime-based (ns-ALEX) measurements are presented and compared to identical measurements performed with standard thick SPADs. Our results demonstrate the great potential of this new detector for smFRET measurements and beyond.

Keywords: ALEX; FRET; SPAD; TCSPC; confocal; diffusion; lifetime; single-molecule.


Figures

Figure 1
Figure 1
DNA sequence used in this work, with location of the dyes indicated for each sample (A: acceptor, D: donor).
Figure 2
Figure 2
Setup schematics showing the excitation paths (top right) and the emission path (bottom left) as well as the data acquisition system (bottom right). A detailed description of the setup can be found in the main text. Abbreviations: M = mirror; DM = dichroic mirror; FM = flippable mirror; BP = band-pass filter; L = lens; BE = beam expander; AOM = acousto-optic modulator; PDM = standard custom-technology SPAD; RE-SPAD = red-enhanced custom-technology SPAD; SPCM = Perkin-Elmer SPAD.
Figure 3
Figure 3
Comparison of the FRET histograms obtained with the two different sets of detectors (Polimi: filled gray histogram and Perkin-Elmer: black outline) for all 5 samples (d = 7–27 bp). Both sets of detectors provide identical results, although the Polimi detectors collect slightly less bursts than the Perkin-Elmer ones during the same amount of time, due to their slightly lower PDE.
Figure 4
Figure 4
Nanotime histograms of the FRET population for the 5 samples (d = 7, 12, 17, 22 and 27 from left to right) as collected with the Polimi detectors (top row) and Perkin-Elmer detectors (bottom row). A single laser period of 14.8 ns is shown (first time axis tick: 0 ns, last tick: 16 ns). The black curves (in units of counts per TAC bin) are the calibrated decays, shown with the corresponding multi-exponential fits in red. The IRF is shown in light gray (arbitrary units). The fitted lifetimes are reported in Table 2.
Figure 5
Figure 5
FRET efficiencies measured in this work using different techniques and detectors. The two sets of μs-ALEX measurements performed with different detectors (black squares: Polimi detectors, open circles: Perkin-Elmer detectors) are in excellent agreement with one another and in reasonable agreement with the values obtained using ns-ALEX (black triangles: Polimi detectors, open triangles: Perkin-Elmer detectors), except for the 17 bp sample, where ns-ALEX FRET efficiencies exhibit a significant dispersion. The plain and dashed curves correspond to the prediction of a simple geometric model for the dsDNA molecule and its attached dyes, discussed in the text, for different parameter values r and R0 (values in nm).

References

    1. Vacha M, Habuchi S. Conformation and physics of polymer chains: a single-molecule perspective. NPG Asia Mater. 2010;2(4):134–142.
    1. Michalet X, Weiss S, Jäger M. Single-molecule fluorescence studies of protein folding and conformational dynamics. Chem Rev. 2006;106(5):1785–1813. - PMC - PubMed
    1. Min W, English BP, Luo GB, Cherayil BJ, Kou SC, Xie XS. Fluctuating enzymes: Lessons from single-molecule studies. Accounts Chem Res. 2005;38(12):923–931. - PubMed
    1. DeRocco VC, Anderson T, Piehler J, Erie DA, Weninger K. Four-color single-molecule fluorescence with noncovalent dye labeling to monitor dynamic multimolecular complexes. Biotechniques. 2010;49(5):807–816. - PMC - PubMed
    1. Heilemann M, Kasper R, Tinnefeld P, Sauer M. Dissecting and Reducing the Heterogeneity of Excited-State Energy Transport in DNA-Based Photonic Wires. J Am Chem Soc. 2006;128(51):16864–16875. - PubMed

LinkOut - more resources