

Geographical and environmental factors driving the increase in the Lyme disease vector Ixodes scapularis
- PMID: 24371541
- PMCID: PMC3872055
- DOI: 10.1890/ES12-00134.1
Geographical and environmental factors driving the increase in the Lyme disease vector Ixodes scapularis
Abstract
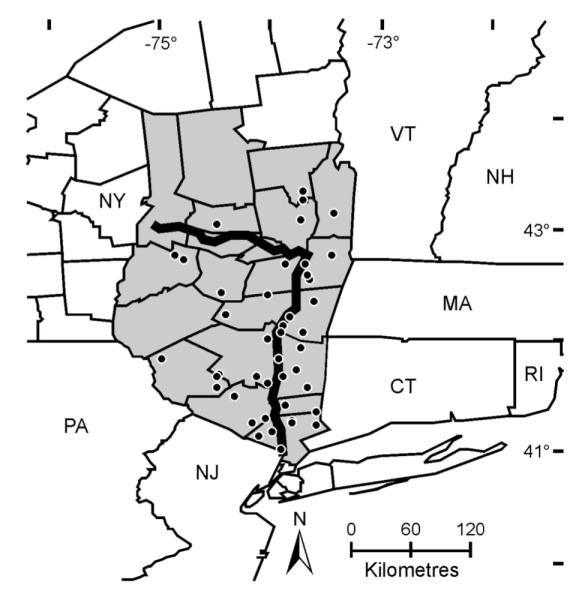
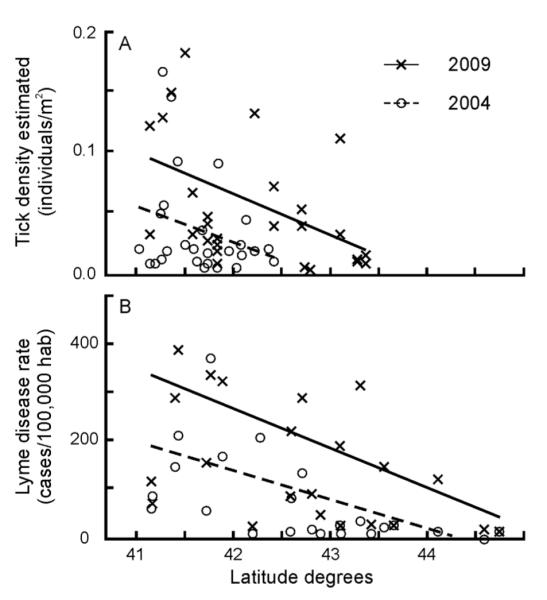
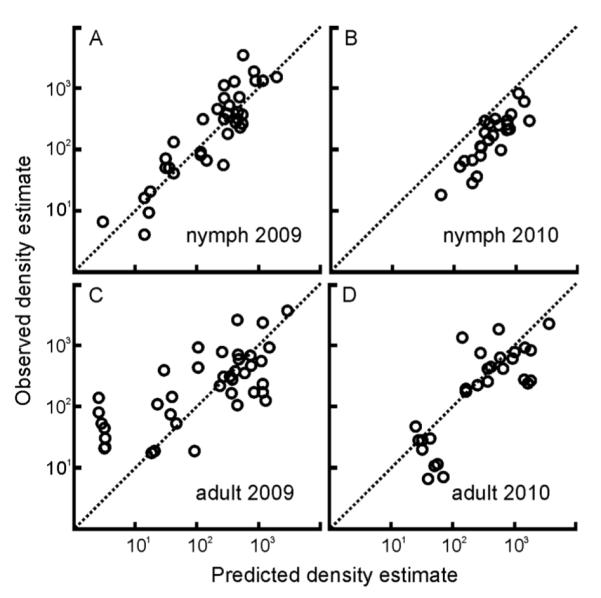
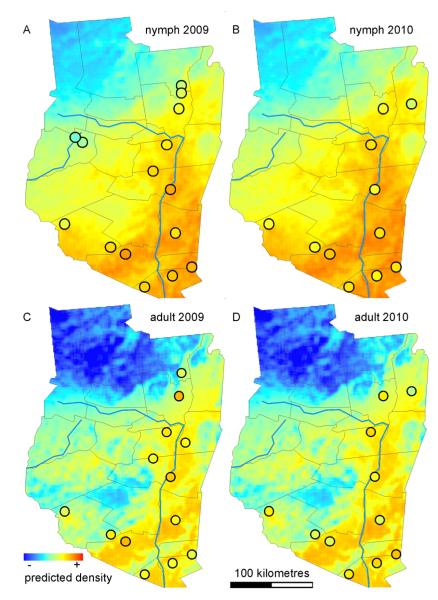
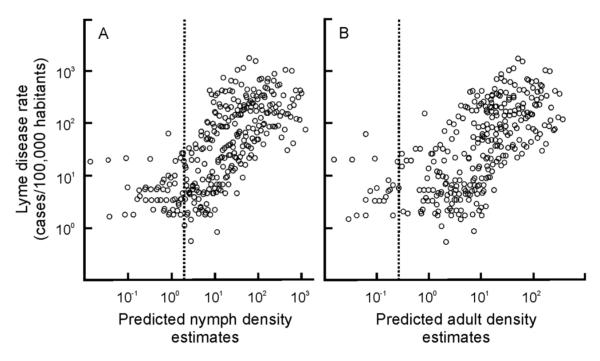
The population densities of many organisms have changed dramatically in recent history. Increases in the population density of medically relevant organisms are of particular importance to public health as they are often correlated with the emergence of infectious diseases in human populations. Our aim is to delineate increases in density of a common disease vector in North America, the blacklegged tick, and to identify the environmental factors correlated with these population dynamics. Empirical data that capture the growth of a population are often necessary to identify environmental factors associated with these dynamics. We analyzed temporally- and spatially-structured field collected data in a geographical information systems framework to describe the population growth of blacklegged ticks (Ixodes scapularis) and to identify environmental and climatic factors correlated with these dynamics. The density of the ticks increased throughout the study's temporal and spatial ranges. Tick density increases were positively correlated with mild temperatures, low precipitation, low forest cover, and high urbanization. Importantly, models that accounted for these environmental factors accurately forecast future tick densities across the region. Tick density increased annually along the south-to-north gradient. These trends parallel the increases in human incidences of diseases commonly vectored by I. scapularis. For example, I. scapularis densities are correlated with human Lyme disease incidence, albeit in a non-linear manner that disappears at low tick densities, potentially indicating that a threshold tick density is needed to support epidemiologically-relevant levels of the Lyme disease bacterium. Our results demonstrate a connection between the biogeography of this species and public health.
Keywords: GIS; Ixodes scapularis; blacklegged ticks; density increase; emerging zoonoses; geographic information systems.
Figures
References
-
- Abdi H. The Bonferroni and Sidak corrections for multiple comparisons. In: Salkind NJ, editor. Encyclopedia of measurement and statistics. Sage; Thousand Oaks, California, USA: 2007. pp. 103–107.
-
- Akaike H. A new look at the statistical model identification. IEEE Transactions on Automatic Control. 1974;19:716–723.
-
- Allan B, Keesing F, Ostfeld R. Effect of forest fragmentation on Lyme disease risk. Conservation Biology. 2003;17:267–272.
-
- Anderson JF. Mammalian and avian reservoirs for Borrelia burgdorferi. Annals of the New York Academy of Sciences. 1988;539:180–191. - PubMed
-
- Bertrand MR, Wilson ML. Microclimate-dependent survival of unfed adult Ixodes scapularis (Acari:Ixodidae) in nature: life cycle and study design implications. Journal of Medical Entomology. 1996;33:619–627. - PubMed
Grants and funding
LinkOut - more resources
Full Text Sources
Molecular Biology Databases