

Gray matter contamination in arterial spin labeling white matter perfusion measurements in patients with dementia
- PMID: 24371796
- PMCID: PMC3871287
- DOI: 10.1016/j.nicl.2013.11.003
Gray matter contamination in arterial spin labeling white matter perfusion measurements in patients with dementia
Abstract
Introduction: White matter (WM) perfusion measurements with arterial spin labeling can be severely contaminated by gray matter (GM) perfusion signal, especially in the elderly. The current study investigates the spatial extent of GM contamination by comparing perfusion signal measured in the WM with signal measured outside the brain.
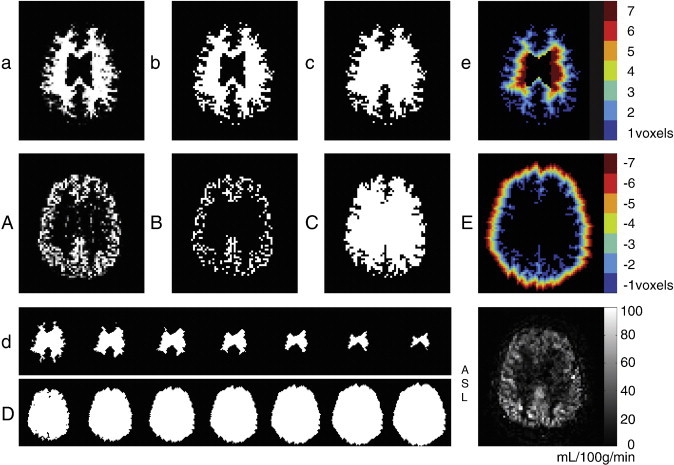
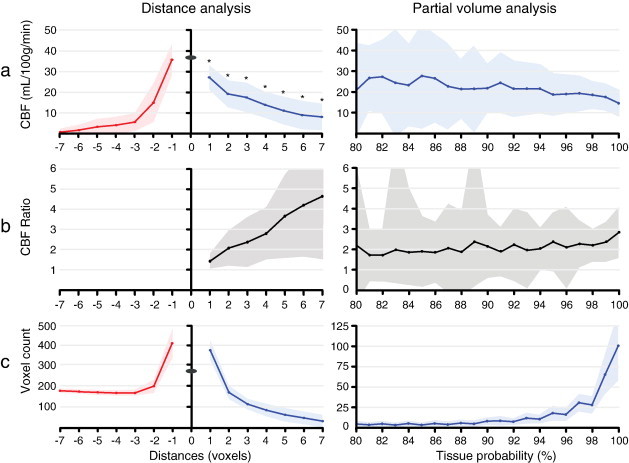
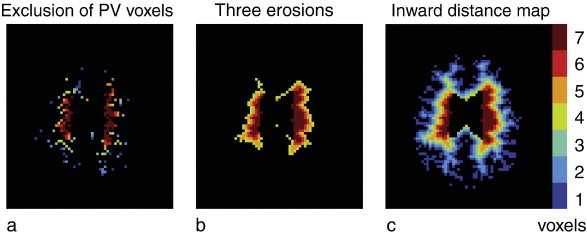
Material and methods: Four minute 3T pseudo-continuous arterial spin labeling scans were performed in 41 elderly subjects with cognitive impairment. Outward and inward geodesic distance maps were created, based on dilations and erosions of GM and WM masks. For all outward and inward geodesic distances, the mean CBF was calculated and compared.
Results: GM contamination was mainly found in the first 3 subcortical WM voxels and had only minor influence on the deep WM signal (distances 4 to 7 voxels). Perfusion signal in the WM was significantly higher than perfusion signal outside the brain, indicating the presence of WM signal.
Conclusion: These findings indicate that WM perfusion signal can be measured unaffected by GM contamination in elderly patients with cognitive impairment. GM contamination can be avoided by the erosion of WM masks, removing subcortical WM voxels from the analysis. These results should be taken into account when exploring the use of WM perfusion as micro-vascular biomarker.
Keywords: ASL, arterial spin labeling; Arterial spin labeling; CBF, cerebral blood flow; CSF, cerebrospinal fluid; Dementia; GM, gray matter; Gray matter contamination; PSF, point spread function; PV, partial volume; Partial volume; SNR, signal-to-noise ratio; WM, white matter; White matter perfusion.
Figures
References
-
- Asllani I., Borogovac A., Brown T.R. Regression algorithm correcting for partial volume effects in arterial spin labeling MRI. Magn. Reson. Med. 2008;60:1362–1371. - PubMed
-
- Bastos-Leite A.J., Kuijer J.P., Rombouts S.A., Sanz-Arigita E., van Straaten E.C., Gouw A.A., van der Flier W.M., Scheltens P., Barkhof F. Cerebral blood flow by using pulsed arterial spin-labeling in elderly subjects with white matter hyperintensities. AJNR Am. J. Neuroradiol. 2008;29:1296–1301. - PMC - PubMed
-
- Brickman A.M., Zahra A., Muraskin J., Steffener J., Holland C.M., Habeck C., Borogovac A., Ramos M.A., Brown T.R., Asllani I., Stern Y. Reduction in cerebral blood flow in areas appearing as white matter hyperintensities on magnetic resonance imaging. Psychiatry Res. 2009;172:117–120. - PMC - PubMed
-
- Chalela J.A., Alsop D.C., Gonzalez-Atavales J.B., Maldjian J.A., Kasner S.E., Detre J.A. Magnetic resonance perfusion imaging in acute ischemic stroke using continuous arterial spin labeling. Stroke. 2000;31:680–687. - PubMed
Publication types
MeSH terms
Substances
LinkOut - more resources
Full Text Sources
Other Literature Sources
Medical
