. 2013 Nov 27;1(6):620-31.
doi: 10.1016/j.stemcr.2013.10.007. eCollection 2013.

Derivation and FACS-mediated purification of PAX3+/PAX7+ skeletal muscle precursors from human pluripotent stem cells

Affiliations

Derivation and FACS-mediated purification of PAX3+/PAX7+ skeletal muscle precursors from human pluripotent stem cells

Bianca Borchin et al. Stem Cell Reports. .

Abstract

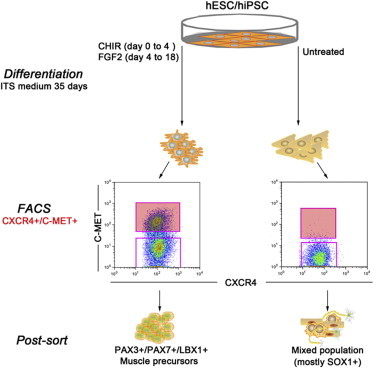
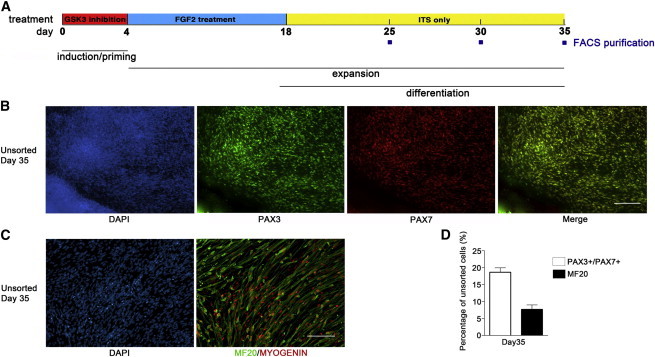
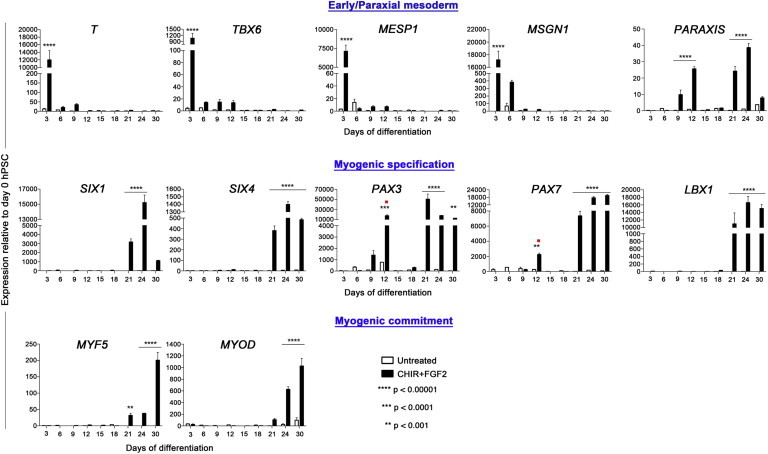
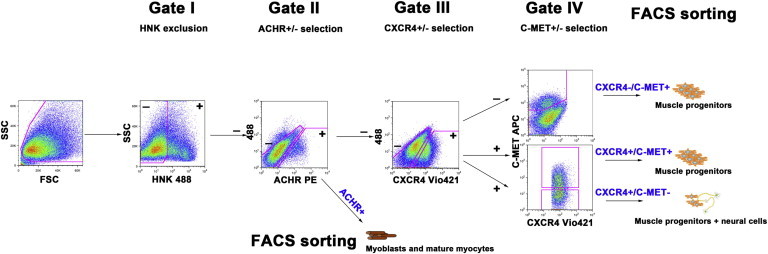
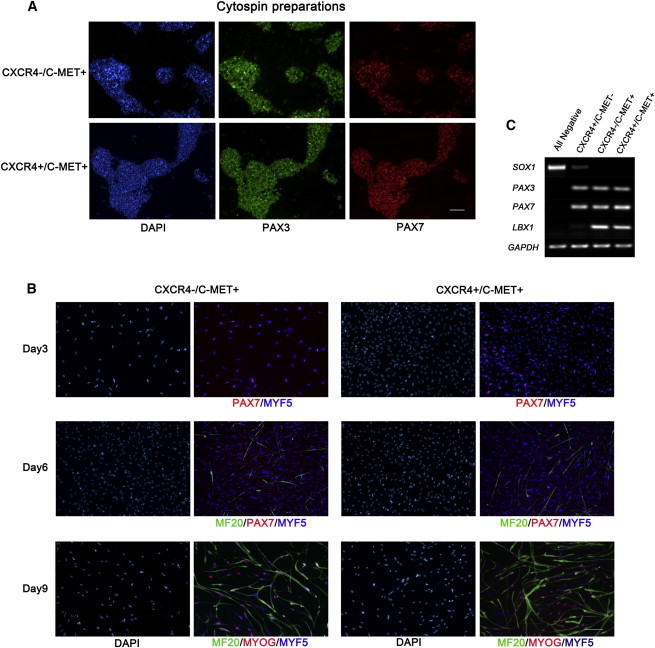
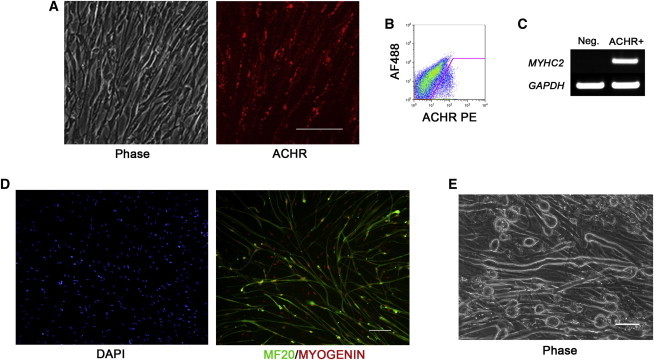
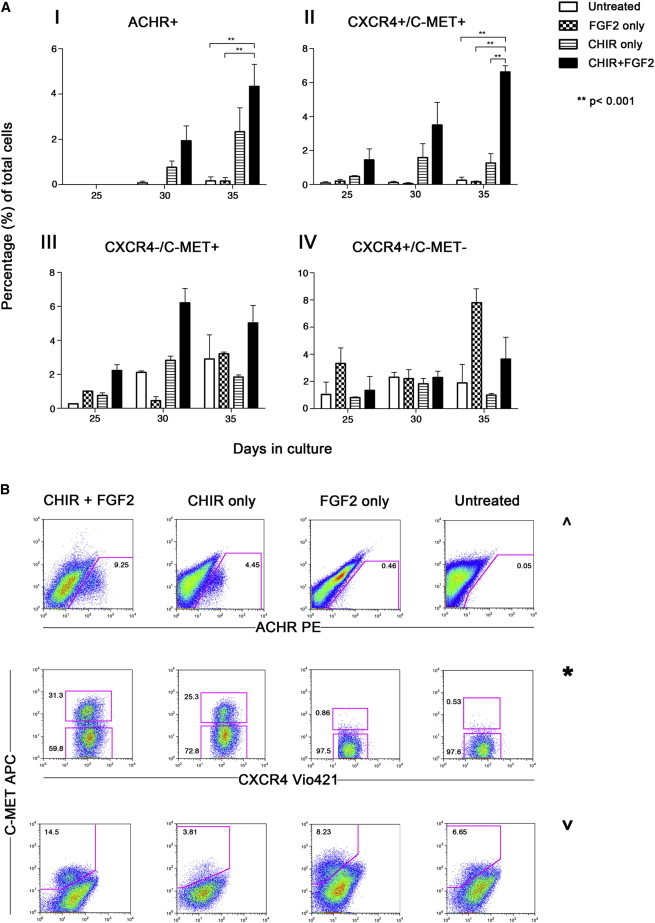
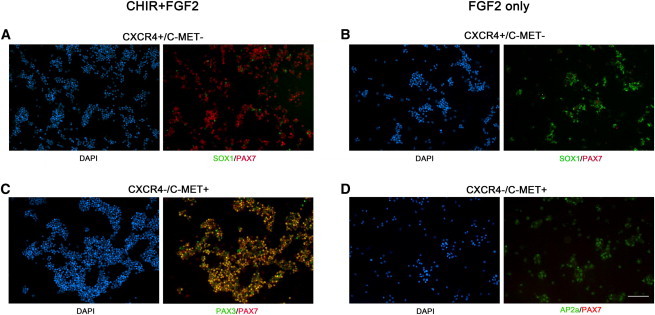
Human pluripotent stem cells (hPSCs) constitute a promising resource for use in cell-based therapies and a valuable in vitro model for studying early human development and disease. Despite significant advancements in the derivation of specific fates from hPSCs, the generation of skeletal muscle remains challenging and is mostly dependent on transgene expression. Here, we describe a method based on the use of a small-molecule GSK3β inhibitor to derive skeletal muscle from several hPSC lines. We show that early GSK3β inhibition is sufficient to create the conditions necessary for highly effective derivation of muscle cells. Moreover, we developed a strategy for stringent fluorescence-activated cell sorting-based purification of emerging PAX3+/PAX7+ muscle precursors that are able to differentiate in postsort cultures into mature myocytes. This transgene-free, efficient protocol provides an essential tool for producing myogenic cells for in vivo preclinical studies, in vitro screenings, and disease modeling.


Figures

None
Graphical abstract
Figure 1
Figure 1
Derivation of Skeletal Muscle from hPSCs (A) Schematic diagram summarizing the treatment protocol for inducing myogenic differentiation from hPSCs. (B and C) Immunocytochemical detection of (B) representative fields of PAX3+ and PAX7+ skeletal muscle precursors and (C) MF20+/Myogenin+ mature skeletal myocytes in unsorted cultures at day 35 of hESC (H9) differentiation, under treatment conditions. Scale bar = 50 μm. (D) Quantitative analysis of PAX3+/7+ nuclei and MF20+ cells at day 35 of hPSC differentiation (H9, HES3, MEL1, and DPL-iPS; n = 4) in unsorted cultures. Error bars represent the SEM of three or more individual experiments. See also Figure S1.
Figure 2
Figure 2
Detection of Gene Transcripts Relevant to the Acquisition of a Myogenic Cell Fate qPCR analysis showing transcript levels of key muscle development genes from hPSCs (DPL-iPS, H9, MEL1, and HES3; n = 4) differentiating under treatment conditions versus medium alone. Cells were collected and analyzed at 3-day intervals between days 0 and 30 of hPSC differentiation. The relative expression level of each gene is calibrated to its expression at day 0 (represented on the y axis). Cycle threshold (Ct) values for each gene are normalized to the Ct values of the reference gene, GAPDH. Values represent mean ± SEM of four independent experiments. Red dots mark early peaks of PAX3 and PAX7 expression corresponding to the timing of development of early dorsal neural tissues (roof plate/neural crest). Error bars represent the SEM of three or more individual experiments.
Figure 3
Figure 3
FACS Strategy for the Isolation of Myogenic Cell Populations Representative experiment in which hESCs (MEL1) that differentiated for 35 days under treatment conditions were sorted based on their HNK, AChR, CXCR4, and C-MET surface marker expression. The gates in each dot plot designate the cell fraction analyzed for the prospective steps; +/− is indicative of either positive or negative expression of each surface antigen. The myogenic cell populations collected from sorting were as follows: (HNK-/AChR+), (HNK−/AChR−/CXCR4−/C-MET+), (HNK−/AChR−/CXCR4+/C-MET+), (HNK−/AChR−/CXCR4+/C-MET−). Gate I: HNK− cells were selected to exclude HNK+ neural/neural crest component. Gate II: selection of HNK−/AChR− cells for myogenic progenitor isolation at subsequent steps or direct isolation of HNK−/AChR+ mature myocytes. Gate III: selection of CXCR4+/− cells. Gate IV: isolation of myogenic progenitor cell populations (HNK−/AChR−/CXCR4−/C-MET+ from gated CXCR4− cells, and HNK−/AChR−/CXCR4+/C-MET+, and HNK−/AChR−/CXCR4+/C-MET−from gated CXCR4+ cells).
Figure 4
Figure 4
Characterization of CXCR4−/C-MET+ and CXCR4+/C-MET+ Sorted Populations (A) Cytospin preparations of muscle progenitor cell populations CXCR4−/C-MET+ (top) and CXCR4+/C-MET+ (bottom) sorted at day 35 of hESC (HES3) differentiation. Cells were cytospun on glass slides and analyzed by immunocytochemistry for myogenic stem cell markers PAX3 (green) and PAX7 (red) immediately following sorting. Each dot represents one nucleus as confirmed by DAPI counterstaining. (B) Immunostaining of replated muscle progenitors CXCR4−/C-MET+ (left) and CXCR4+/C-MET+ (right) (from hESCs [MEL1]) at days 3, 6, and 9 of postsorting cultures shows progression toward a muscle terminal differentiation phenotype. (C) RT-PCR analysis of skeletal muscle progenitor genes (PAX3, PAX7, and LBX1) and neural gene (SOX1) in all sorted populations (from DPL-iPS) derived under treatment conditions. Myog, myogenin; MF20, sarcomeric myosin. Scale bars, 50 μm. See also Figure S2.
Figure 5
Figure 5
Isolation of AChR+ Skeletal Myocytes (A) Phase-contrast image (left) and immunocytochemical analysis for AChR expression (right) on hESC-derived (MEL1) skeletal myocytes prior to FACS isolation. (B) FACS profile of AChR+ cell population (from hESC-H9). (C) RT-PCR analysis of mature skeletal muscle marker MYH2 in AChR− cells (Neg) and AChR+ cells (from HES3). (D) Immunocytochemical analysis of hESC-derived AChR+ myocytes (H9) 24 hr postsort, expressing mature skeletal muscle proteins (MF20 and Myog). (E) Phase-contrast image showing the morphology of AChR+ myocyte-derived myotubes (from H9) after prolonged cell culture (>20 days). Scale bars, 50 μm.
Figure 6
Figure 6
Quantification of Muscle-Enriched Cell Populations under Four Different Treatment Conditions AChR+, CXCR4+/C-MET+, CXCR4−/C-MET+, and CXCR4+/C-MET− cell populations derived from hPSCs differentiated under four treatment conditions (CHIR+FGF2, CHIR only, FGF2 only, and untreated) were quantified. (A) Percentage of AChR+ myocytes (I), CXCR4+/C-MET+ (II) and CXCR4−/C-MET+ (III) precursors, and CXCR4+/C-MET− (IV) mixed population from multiple FACS purification experiments at three different time points. Results shown for each treatment condition represent three experiments averaged from each of the four hPSC lines. (I and II) Fold change difference is observed between CHIR+FGF2 treatment and all other conditions at each time point. CHIR+FGF2 treatment significantly (p < 0.001) improves induction of both cell populations at day 35 of differentiation compared with FGF2-only or untreated cultures. (III and IV) The percentage of cells is independent of treatment; however, cell composition is altered (refer to Figure 7). (B) Representative FACS profile of hPSCs (H9) at day 35 of differentiation. The sorted populations are represented as percentage fractions of the respective parent population. AChR+ (top) and CXCR4+/C-MET+ (middle) cell populations are only present in CHIR-treated hPSCs, whereas CXCR4+/C-MET− (middle) and CXCR4−/C-MET+ (bottom) cell populations are present under all conditions. ˆ % of AChR+ gated populations based on HNK− gated fractions; % of CXCR4+/C-MET+ and CXCR4+/C-MET− gated populations based on HNK−/AChR−/CXCR4+ gated fractions; v % of CXCR4−/C-MET+ gated populations based on HNK−/AChR−/CXCR4− gated fractions. Error bars represent the SEM of three or more individual experiments. See also Figure S3.
Figure 7
Figure 7
Lack of CHIR Treatment during hPSC Differentiation Results in the Absence of a Muscle Phenotype (A–D) Immunocytochemical analysis from cytospin preparations of CXCR4+/C-MET− (A and B) and CXCR4−/C-MET+ (C and D) sorted cells. (A) Under CHIR+FGF2 treatment, the majority of CXCR4+/C-MET− cells are PAX7+, indicating a predominant muscle phenotype. (B) A complete switch toward SOX1 expression is observed in FGF2-only conditions. (C) The CXCR4−/C-MET+ cell population derived from CHIR+FGF2-treated hPSCs is composed of highly enriched PAX3+/PAX7+ muscle precursors. (D) PAX3+ and PAX7+ cells are not present under FGF2-alone conditions, with a large number of cells instead expressing the nonneural ectoderm marker AP2α. Scale bars, 50 μm. All images from hESC HES3.

References

    1. Aulehla A., Pourquié O. Signaling gradients during paraxial mesoderm development. Cold Spring Harb. Perspect. Biol. 2010;2:a000869. - PMC - PubMed
    1. Barberi T., Bradbury M., Dincer Z., Panagiotakos G., Socci N.D., Studer L. Derivation of engraftable skeletal myoblasts from human embryonic stem cells. Nat. Med. 2007;13:642–648. - PubMed
    1. Bladt F., Riethmacher D., Isenmann S., Aguzzi A., Birchmeier C. Essential role for the c-met receptor in the migration of myogenic precursor cells into the limb bud. Nature. 1995;376:768–771. - PubMed
    1. Brehm P., Henderson L. Regulation of acetylcholine receptor channel function during development of skeletal muscle. Dev. Biol. 1988;129:1–11. - PubMed
    1. Buckingham M. Myogenic progenitor cells and skeletal myogenesis in vertebrates. Curr. Opin. Genet. Dev. 2006;16:525–532. - PubMed

Publication types

MeSH terms

LinkOut - more resources