. 2013 Oct;12(7):1-13.

NanoLuc reporter for dual luciferase imaging in living animals

NanoLuc reporter for dual luciferase imaging in living animals

Amanda C Stacer et al. Mol Imaging. 2013 Oct.

Abstract

Bioluminescence imaging is widely used for cell-based assays and animal imaging studies in biomedical research and drug development, capitalizing on the high signal to background of this technique. A relatively small number of luciferases are available for imaging studies, substantially limiting the ability to image multiple molecular and cellular events, as done commonly with fluorescence imaging. To advance dual reporter bioluminescence molecular imaging, we tested a recently developed, adenosine triphosphate–independent luciferase enzyme from Oplophorus gracilirostris (NanoLuc [NL]) as a reporter for animal imaging. We demonstrated that NL could be imaged in superficial and deep tissues in living mice, although the detection of NL in deep tissues was limited by emission of predominantly blue light by this enzyme. Changes in bioluminescence from NL over time could be used to quantify tumor growth, and secreted NL was detectable in small volumes of serum. We combined NL and firefly luciferase reporters to quantify two key steps in transforming growth factor β signaling in intact cells and living mice, establishing a novel dual luciferase imaging strategy for quantifying signal transduction and drug targeting. Our results establish NL as a new reporter for bioluminescence imaging studies in intact cells and living mice that will expand imaging of signal transduction in normal physiology, disease, and drug development.


Figures

Fig 1
Fig 1. Enhanced signal from cell-associated and secreted NL
A) We measured bioluminescence in supernatants and intact 293T cells transiently transfected with NL or GL. Graph displays mean values + SEM for bioluminescence from each luciferase enzyme normalized to co-transfected FL (n = 4 per condition). In some panels, error bars are smaller than corresponding symbols for each data point. B) Equal concentrations of furimazine or coelenterazine were added to MDA-MB-231 human breast cancer cells stably transduced with NL (231-NL) or GL (231-GL), respectively. Graph shows mean values ± SEM for bioluminescence relative to initial photon flux for each enzyme measured for over the initial 30 seconds of imaging after adding substrate (n = 4 per condition). Inset shows actual photon flux values for the initial 30 seconds of imaging for 231-NL and 231-GL cells. ***, p < 0.005. C) Total cell lysates from 231-NL or 231-GL cells were probed with antibodies to NL or GL, respectively. Western blots were stripped and probed for GAPDH as a control for equal loading. Ratios of band intensities for NL or GL relative to GAPDH were quantified by Image J. D, E) Graphs display bioluminescence quantified in supernatants (D) and intact cells (E) from listed numbers of 231-NL and 231-GL cells. Graph shows mean values + SEM for each enzyme (n = 4 per condition). R values denote goodness of fit for linear regression analysis of data.
Fig 2
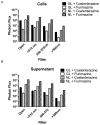
Fig 2. Comparative analysis of substrate specificity for NL and GL
A, B), We incubated 231-NL or 231-GL cells (A) or supernatants from these cells (B) with equal concentrations of furimazine or coelenterazine and measured bioluminescence with open filter or filters for < 510 nm, 500–570 nm, or > 590 nm light. Graphs show mean values (n = 4 per condition). Error bars for SEM are not apparent on this log scale.
Fig 3
Fig 3. Imaging NL in mammary tumor xenografts
A) Representative bioluminescence images of a mouse implanted with 231-NL cells in the animal’s left mammary fat pad after injection of furimazine. Images were obtained with open emission and selective bandpass filters listed below each image. B) Graph depicts mean values ± SEM for bioluminescence at each wavelength as a per cent of open filter photon flux (n = 5). C) Mice were imaged for NL bioluminescence with sequential 10-second images and open filter. Data were graphed as mean values ± SEM as a per cent of NL photon flux on the initial image (n = 4). D) Representative bioluminescence images of mice implanted with 231-GL and 231-NL cells as tumor xenografts and injected intravenously with coelenterazine. E) Graph depicts mean values ± SEM for bioluminescence from GL and NL in response to coelenterazine (n = 5). Error bars for some data points are smaller than the corresponding symbol.
Fig 4
Fig 4. Imaging NL bioluminescence in lung
A) Mice were injected intravenously with 231-NL/FL cells to produce experimental lung metastases. Bioluminescence images show the same mice imaged for NL or FL signals. B) Graph displays mean values ± SEM for signal from NL (furimazine) or FL (luciferin) (n = 10 mice). C) Parallel cohorts of mice (n = 5 each) were injected intravenously with 231-GL or 231-NL/FL cells to produce lung metastases. Graph shows mean values ± SEM for photon flux over three time points after injection (n = 5). E) We collected serum samples from mice described in panel D and quantified bioluminescence from GL or NL. Graph shows mean values + SEM for bioluminescence from each secreted luciferase.
Fig 5
Fig 5. Dual luciferase imaging of TGF-β signaling in cell-based assays
A) Schematic of NL and FL reporter constructs. Expression of NL is regulated by a promoter with a SMAD binding element (SBE), so canonical TGF-β signaling increases bioluminescence. The BTR FL reporter utilizes luciferase complementation to detect phosphorylation of the sensor by TGF-βR1. TGF-β signaling decreases bioluminescence from this reporter. B) A549 cells stably expressing a FL reporter for kinase activity of the type I receptor for TGF-β (BTR) were transiently transfected with SBE-NL and treated with 10 ng/ml TGF-β in the absence or presence of 10 μM of the TGF-βR1 kinase inhibitors SB431542 or SD208 for 22 hours. Graph shows mean values ± SEM for firefly luciferase activity (n = 3 per condition). Inset shows bioluminescence image of the 12 well plate and Western blot for levels of NL protein under various treatment conditions. Band intensities quantified by ImageJ were normalized to GAPDH, and values under the blot show induction relative to mock treatment. C) Stably transfected A549-BTR/SBE-NL cells were treated for 22 hours with increasing concentrations of TGF-β before quantifying NL bioluminescence. Graph shows mean values + SEM (n = 4 per condition). D) Graph shows mean values +SEM for NL bioluminescence in cells treated with 10 ng/ml TGF-β for 22 hours without or with increasing concentrations of SD208 (n = 4 per condition). *, p < 0.01; **, p < 0.001. E) Bioluminescence microscopy of A549-BTR/SBE-NL cells treated as described for panel D.
Fig 6
Fig 6. Imaging TGF-β signaling with NL and FL in living mice
A) Mice were implanted with A549-BTR/SBE-NL cells and treated with 100 ng TGF-β, 50 mg/kg SD208, or both TGF-β and SD208 (n = 5 per group). A) Bioluminescence images of SBE-NL activity show representative mice from each group prior to treatment and at times 6 and 24 hours after treatment. Pseudocolor scale shows range of depicted photon flux values. B) NL data for 6 and 24 hour time points for each mouse were normalized to corresponding photon flux values prior to treatment. Graph shows mean values + SEM for percent change relative to untreated animals in each group at 6 and 24 hour time points. C) Representative FL bioluminescence images of mice treated as described in panel A. D) Graph depicts mean values + SEM for each treatment condition after 6 and 24 hours. *, p<0.05; **, p<0.01 relative to pre-treatment values.

References

    1. Paulmurugan R, Gambhir S. Firefly luciferase enzyme fragment complementation for imaging in cells and living animals. Anal Chem. 2005;77(5):1295–1302. - PMC - PubMed
    1. Zhang L, Lee K, Bhojani M, et al. Molecular imaging of Akt kinase activity. Nat Med. 2007;13(9):1114–1119. - PubMed
    1. Luker K, Gupta M, Steele J, Foerster B, Luker G. Imaging ligand-dependent activation of CXCR7. Neoplasia. 2009;11(10):1022–1035. - PMC - PubMed
    1. Liu H, Patel M, Prescher J, et al. Cancer stem cells from human breast tumors are involved in spontaneous metastases in orthotopic mouse models. Proc Natl Acad Sci U S A. 2010;107(42):18115–18120. - PMC - PubMed
    1. Niers J, Kerami M, Pike L, Lewandrowski G, Tannous B. Multimodal in vivo imaging and blood monitoring of intrinsic and extrinsic apoptosis. Mol Ther. 2011;19(6):1090–1096. - PMC - PubMed

Publication types

MeSH terms