. 2014 Jan;171(2):523-35.
doi: 10.1111/bph.12496.

Metformin modulates hyperglycaemia-induced endothelial senescence and apoptosis through SIRT1

Affiliations

Metformin modulates hyperglycaemia-induced endothelial senescence and apoptosis through SIRT1

Gnanapragasam Arunachalam et al. Br J Pharmacol. 2014 Jan.

Abstract

Background and purpose: Endothelial dysfunction can be detected at an early stage in the development of diabetes-related microvascular disease and is associated with accelerated endothelial senescence and ageing. Hyperglycaemia-induced oxidative stress is a major contributing factor to the development of endothelial dysfunction. Clinical data indicate that the hypoglycaemic agent, metformin, has an endothelial protective action; however, its molecular and cellular mechanisms remain elusive. In the present study, we have investigated the protective effect of metformin during hyperglycaemia-induced senescence in mouse microvascular endothelial cells (MMECs).

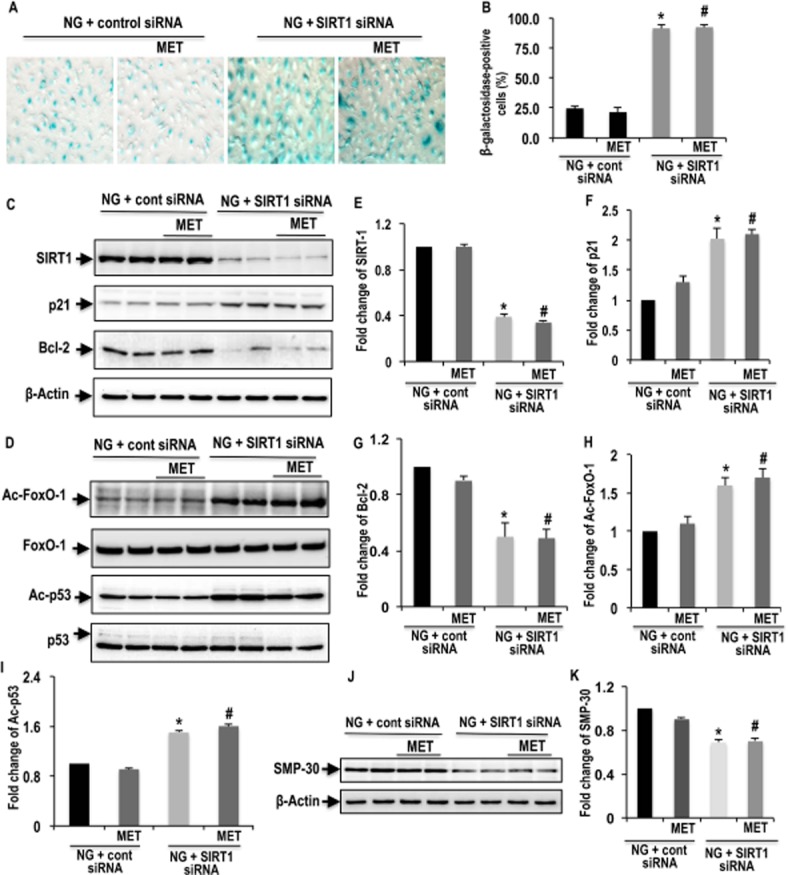
Experimental approach: MMECs were cultured in normal glucose (11 mM) and high glucose (HG; 40 mM) in the presence and absence of metformin (50 μM) for 72 h. The expression of sirtuin-1 (SIRT1) and senescence/apoptosis-associated markers was determined by immunoblotting and immunocyto techniques. SIRT1 expression was inhibited with appropriate siRNA.

Key results: Exposure of MMECs to HG significantly reduced SIRT1 protein expression, increased forkhead box O1 (FoxO-1) and p53 acetylation, increased p21 and decreased Bcl2 expression. In addition, senescence-associated β-galactosidase activity in MMECs was increased in HG. Treatment with metformin attenuated the HG-induced reduction of SIRT1 expression, modulated the SIRT1 downstream targets FoxO-1 and p53/p21, and protected endothelial cells from HG-induced premature senescence. However, following gene knockdown of SIRT1 the effects of metformin were lost.

Conclusions and implications: HG-induced down-regulation of SIRT1 played a crucial role in diabetes-induced endothelial senescence. Furthermore, the protective effect of metformin against HG-induced endothelial dysfunction was partly due to its effects on SIRT1 expression and/or activity.

Keywords: FoxO-1; endothelial dysfunction; forkhead box O1 transcription factor; hyperglycaemia; metformin; microvascular endothelial cells; reactive oxygen species; sirtuin1; vascular senescence.


Figures

Figure 1
Figure 1
Effect of HG exposure on SIRT1, FoxO-1 and p21 expression in MMECs. MMECs were cultured either in NG (11 mM) or HG (40 mM) media for 72 h, and SIRT1, p21, p-FoxO-1, Ac-FoxO-1 and FoxO-1 protein levels were determined by immunoblotting (A, B). Results were normalized to controls, and histograms represent the relative intensity of SIRT1, p21, p-FoxO-1 and Ac-FoxO-1 (C–F). Values represent mean ± SEM (n = 3–4 per group). *P < 0.05, significantly different from NG. For the studies comparing the effects of mannitol and 3-OMG, MMECs were also incubated with media consisting of NG (11 mM) or HG (40 mM), d-mannitol and 3-OMG for 72 h, and SIRT1 protein levels were determined by immunoblotting (G). Histogram represents the relative intensity of SIRT1 (H). Values represent mean ± SEM (n = 3–4 per group). *P < 0.05, significantly different from NG.
Figure 2
Figure 2
Effect of treatment with metformin on HG-induced oxidative stress, senescence, SIRT1 protein expression and its downstream signalling in MMECs. MMECs were cultured either in NG (11 mM) or HG (40 mM) media for 72 h in the presence or absence of metformin (MET; 50 μM). Cells were fixed and stained with DHE to detect intracellular ROS levels (A; 63× magnification). Panel B shows the relative intensity of ethidium fluorescence signal. Values represent mean ± SEM. *P < 0.05, significantly different from NG; #P < 0.05, significantly different from HG. Cells were fixed and stained for senescence-associated β-galactosidase activity (C; 20× magnification). Histogram represents the percentage of senescence-associated β-galactosidase-positive cells (D). Values represent mean ± SEM. *P < 0.05, significantly different from NG; #P < 0.05, significantly different from HG. A representative image from three separate experiments is illustrated. Cell lysates were used to detect the SIRT1, p21, Bcl-2, Ac-FoxO-1, FoxO-1, Ac-p53, p53 and SMP-30 protein levels by immunoblotting (E–F and L). Results were normalized to controls, and histograms represent the relative intensity of SIRT1, p21, Bcl-2, Ac-FoxO-1, Ac-p53 and SMP-30 levels (G–K and M). Values represent mean ± SEM (n = 3–4 per group). *P < 0.05, significantly different from NG; #P < 0.05, significantly different from HG.
Figure 3
Figure 3
Effect of treatment with metformin during HG exposure on expression of Ac-FoxO-1 and p21 in MMECs. MMECs were cultured either in NG (11 mM) or HG (40 mM) media for 72 h in the presence and absence of metformin (50 μM). Acetylated FoxO-1 (A) and p21 (B) levels were measured by immunofluorescence staining. The images are taken by 63× magnification. A representative image from three separate experiments is illustrated.
Figure 4
Figure 4
SIRT1 knockdown accelerates endothelial cell senescence. MMECs were transfected with either control siRNA or SIRT1 siRNA and exposed to NG (11 mM) in the presence or absence of metformin (MET). After 72 h of transfection, cells were fixed and stained for senescence-associated β-galactosidase activity (A; 20× magnification). Histogram represents the percentage of senescence-associated β-galactosidase-positive cells (B). Values represent mean ± SEM. *P < 0.05, significantly different from control siRNA; #P < 0.05, significantly different from siRNA-transfected cells alone or with metformin. A representative image from three separate experiments is illustrated. Cell lysates were used for immunoblotting assessment of SIRT1, p21, Bcl-2, Ac-FoxO-1, FoxO-1, Ac-p53, p53 and SMP-30 levels (C, D and J). Results were normalized to controls, and histograms represent the relative intensity of SIRT1, p21, Bcl-2, Ac-FoxO-1, Ac-p53 and SMP-30 levels (E–I and K). Values represent mean ± SEM (n = 3–4 per group). *P < 0.05, significantly different from control siRNA; #P < 0.05, significantly different from control siRNA-transfected cells alone or with metformin.
Figure 5
Figure 5
Effect of SIRT1 silencing on expression of Ac-FoxO-1 and p21 in MMECs. MMECs were transfected with either control siRNA or SIRT1 siRNA alone or with metformin (MET). Immunofluorescence staining was used to measure the level of protein expression for Ac-FoxO-1 (A) and p21 (B). The images were taken with a magnification of 63×. A representative image from three separate experiments is illustrated.
Figure 6
Figure 6
Effect of metformin treatment on HG-induced senescence in SIRT1-silenced endothelial cells. MMECs were transfected with either control siRNA or SIRT1 siRNA and exposed to HG (40 mM) in the presence or absence of metformin (MET). After 72 h of transfection, cells were fixed and stained for senescence-associated β-galactosidase activity (A; 20× magnification). Histogram represents the percentage of senescence-associated β-galactosidase-positive cells (B). Values represent mean ± SEM. *P < 0.05, significantly different from control siRNA transfected cells. A representative image from three separate experiments is illustrated. Cell lysates were used for immunoblotting assessment of SIRT1, p21, Bcl-2, Ac-FoxO-1, FoxO-1, Ac-p53 and p53 levels (C, D). Results were normalized to controls, and histograms represent the relative intensity of SIRT1, p21, Bcl-2, Ac-FoxO-1 and Ac-p53 levels (E–I). Values represent mean ± SEM (n = 3–4 per group). *P < 0.05, significantly different from control siRNA-transfected cells exposed to NG, #P < 0.05, significantly different from control siRNA-transfected cells exposed to HG alone; @P < 0.05, significantly different from control siRNA-transfected cells exposed to HG alone; +P < 0.05, significantly different from control siRNA-transfected cells exposed to HG alone or with metformin.
Figure 7
Figure 7
Metformin modulates hyperglycaemia-induced post-translational modification of SIRT1-mediated pathways in endothelial cells. Hyperglycaemia down-regulates expression of SIRT1 and thereby augments the FoxO-1 and p53-mediated endothelial cell senescence and apoptosis. Treatment with metformin up-regulates SIRT1 and attenuates hyperglycaemia-induced endothelial dysfunction.

References

    1. Arunachalam G, Yao H, Sundar IK, Caito S, Rahman I. SIRT1 regulates oxidant- and cigarette smoke-induced eNOS acetylation in endothelial cells: role of resveratrol. Biochem Biophys Res Commun. 2010;393:66–72. - PMC - PubMed
    1. Bai B, Liang Y, Xu C, Lee MY, Xu A, Wu D, et al. Cyclin-dependent kinase 5-mediated hyperphosphorylation of sirtuin-1 contributes to the development of endothelial senescence and atherosclerosis. Circulation. 2012;126:729–740. - PubMed
    1. Balestrieri ML, Rienzo M, Felice F, Rossiello R, Grimaldi V, Milone L, et al. High glucose downregulates endothelial progenitor cell number via SIRT1. Biochim Biophys Acta. 2008;1784:936–945. - PubMed
    1. Brunet A, Sweeney LB, Sturgill JF, Chua KF, Greer PL, Lin Y, et al. Stress-dependent regulation of FOXO transcription factors by the SIRT1 deacetylase. Science. 2004;303:2011–2015. - PubMed
    1. Canto C, Gerhart-Hines Z, Feige JN, Lagouge M, Noriega L, Milne JC, et al. AMPK regulates energy expenditure by modulating NAD+ metabolism and SIRT1 activity. Nature. 2009;458:1056–1060. - PMC - PubMed

Publication types

MeSH terms