

A mesh generation and machine learning framework for Drosophila gene expression pattern image analysis
- PMID: 24373308
- PMCID: PMC3879658
- DOI: 10.1186/1471-2105-14-372
A mesh generation and machine learning framework for Drosophila gene expression pattern image analysis
Abstract
Background: Multicellular organisms consist of cells of many different types that are established during development. Each type of cell is characterized by the unique combination of expressed gene products as a result of spatiotemporal gene regulation. Currently, a fundamental challenge in regulatory biology is to elucidate the gene expression controls that generate the complex body plans during development. Recent advances in high-throughput biotechnologies have generated spatiotemporal expression patterns for thousands of genes in the model organism fruit fly Drosophila melanogaster. Existing qualitative methods enhanced by a quantitative analysis based on computational tools we present in this paper would provide promising ways for addressing key scientific questions.
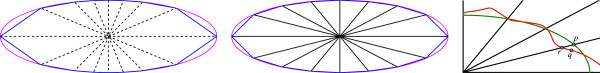
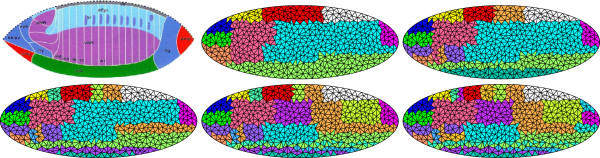
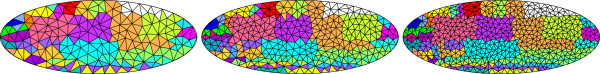
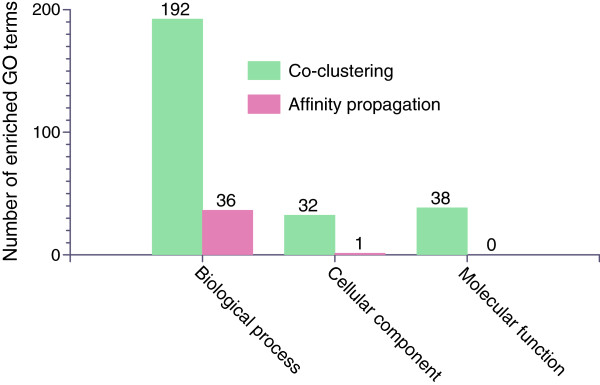
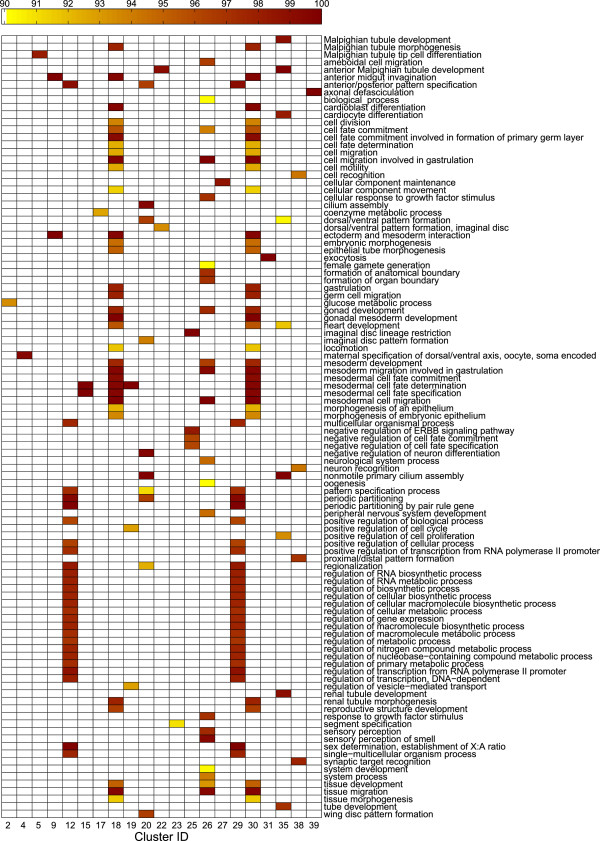
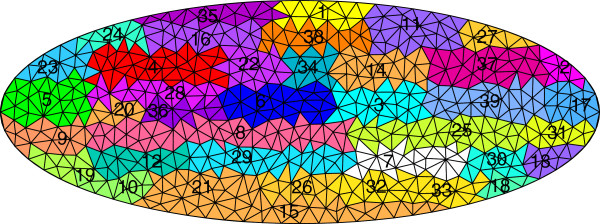
Results: We develop a set of computational methods and open source tools for identifying co-expressed embryonic domains and the associated genes simultaneously. To map the expression patterns of many genes into the same coordinate space and account for the embryonic shape variations, we develop a mesh generation method to deform a meshed generic ellipse to each individual embryo. We then develop a co-clustering formulation to cluster the genes and the mesh elements, thereby identifying co-expressed embryonic domains and the associated genes simultaneously. Experimental results indicate that the gene and mesh co-clusters can be correlated to key developmental events during the stages of embryogenesis we study. The open source software tool has been made available at http://compbio.cs.odu.edu/fly/.
Conclusions: Our mesh generation and machine learning methods and tools improve upon the flexibility, ease-of-use and accuracy of existing methods.
Figures
Similar articles
-
Automatic image analysis for gene expression patterns of fly embryos.BMC Cell Biol. 2007 Jul 10;8 Suppl 1(Suppl 1):S7. doi: 10.1186/1471-2121-8-S1-S7. BMC Cell Biol. 2007. PMID: 17634097 Free PMC article.
-
GINI: from ISH images to gene interaction networks.PLoS Comput Biol. 2013;9(10):e1003227. doi: 10.1371/journal.pcbi.1003227. Epub 2013 Oct 10. PLoS Comput Biol. 2013. PMID: 24130465 Free PMC article.
-
Automated annotation of developmental stages of Drosophila embryos in images containing spatial patterns of expression.Bioinformatics. 2014 Jan 15;30(2):266-73. doi: 10.1093/bioinformatics/btt648. Epub 2013 Dec 3. Bioinformatics. 2014. PMID: 24300439 Free PMC article.
-
Pipeline for acquisition of quantitative data on segmentation gene expression from confocal images.Fly (Austin). 2008 Mar-Apr;2(2):58-66. doi: 10.4161/fly.6060. Epub 2008 Mar 8. Fly (Austin). 2008. PMID: 18820476 Free PMC article. Review.
-
A graphic digital database of Drosophila embryogenesis.Trends Genet. 1995 Feb;11(2):51-8. doi: 10.1016/s0168-9525(00)88997-0. Trends Genet. 1995. PMID: 7716807 Review.
Cited by
-
Deep Model Based Transfer and Multi-Task Learning for Biological Image Analysis.IEEE Trans Big Data. 2020 Jun;6(2):322-333. doi: 10.1109/tbdata.2016.2573280. Epub 2016 May 30. IEEE Trans Big Data. 2020. PMID: 36846743 Free PMC article.
-
Novel image markers for non-small cell lung cancer classification and survival prediction.BMC Bioinformatics. 2014 Sep 19;15(1):310. doi: 10.1186/1471-2105-15-310. BMC Bioinformatics. 2014. PMID: 25240495 Free PMC article.
References
-
- Lodish H, Berk A, Kaiser CA, Krieger M, Scott MP, Bretscher A, Ploegh H, Matsudaira P. Molecular Cell Biology. New York: W. H. Freeman; 2007.
-
- Davidson EH. The Regulatory Genome: Gene Regulatory Networks in Development and Evolution. Burlington: Academic Press; 2006.
-
- Wolpert L, Smith J, Jessell T, Lawrence P, Robertson E, Meyerowitz E. Principles of Development. Oxford: Oxford University Press; 2006.
-
- Campos-Ortega JA, Hartenstein V. The Embryonic Development of Drosophila Melanogaster. New York: Springer; 1997.
Publication types
MeSH terms
Grants and funding
LinkOut - more resources
Full Text Sources
Other Literature Sources
Molecular Biology Databases
