. 2013 Dec 30:14:929.
doi: 10.1186/1471-2164-14-929.

Bulk segregant RNA-seq reveals expression and positional candidate genes and allele-specific expression for disease resistance against enteric septicemia of catfish

Affiliations

Bulk segregant RNA-seq reveals expression and positional candidate genes and allele-specific expression for disease resistance against enteric septicemia of catfish

Ruijia Wang et al. BMC Genomics. .

Abstract

Background: The application of RNA-seq has accelerated gene expression profiling and identification of gene-associated SNPs in many species. However, the integrated studies of gene expression along with SNP mapping have been lacking. Coupling of RNA-seq with bulked segregant analysis (BSA) should allow correlation of expression patterns and associated SNPs with the phenotypes.

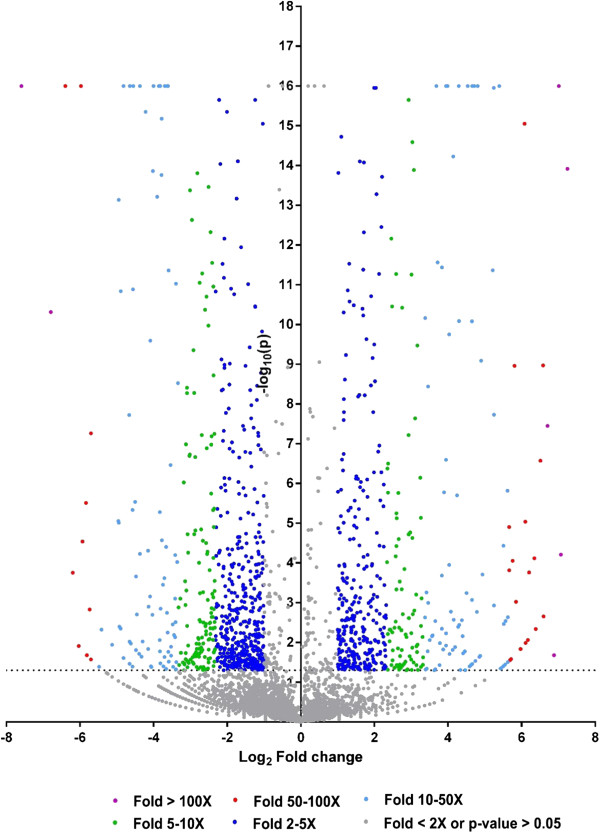
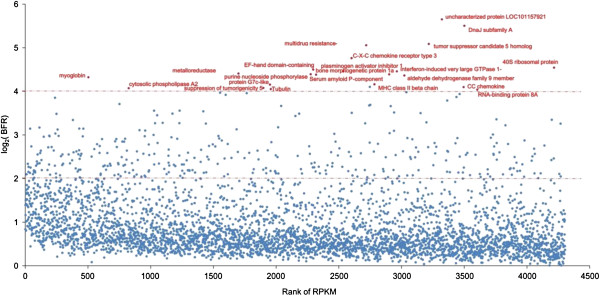
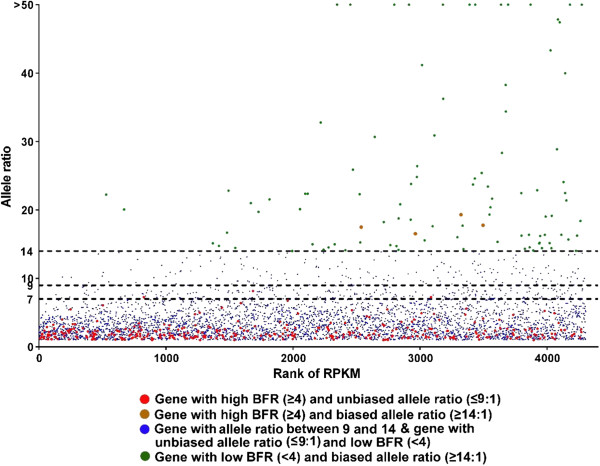
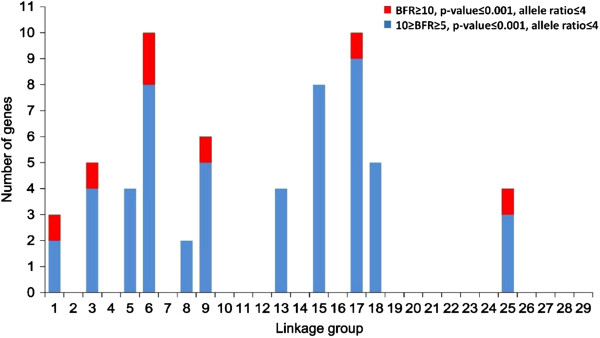
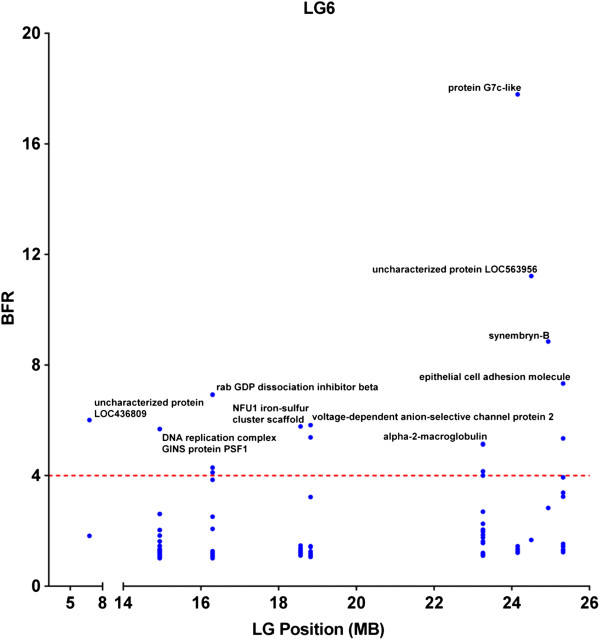
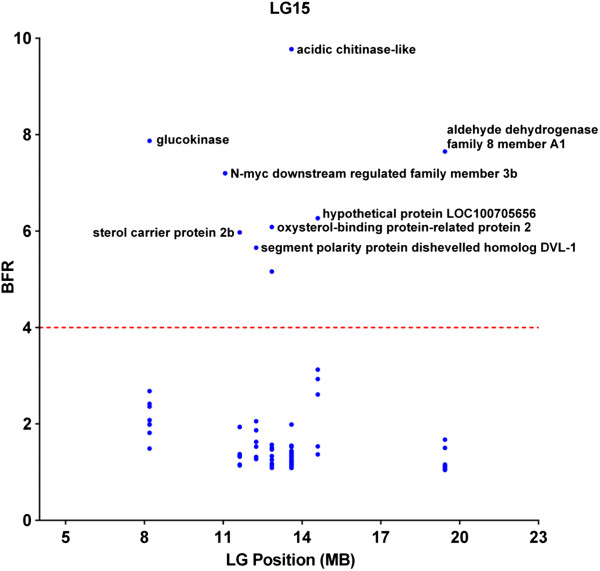
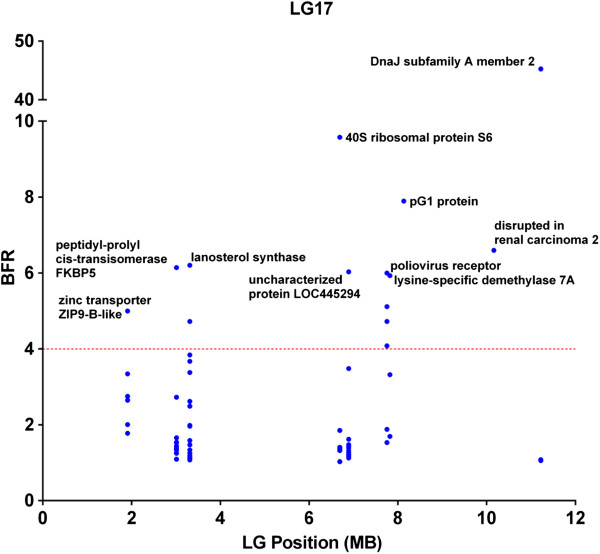
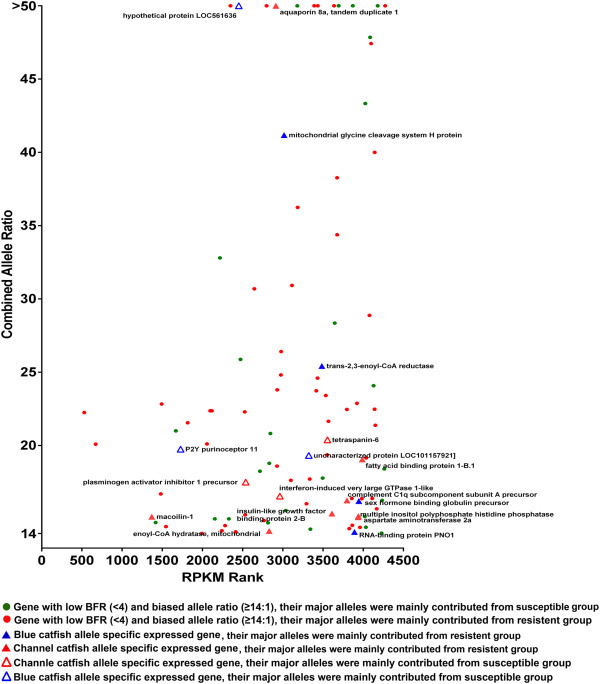
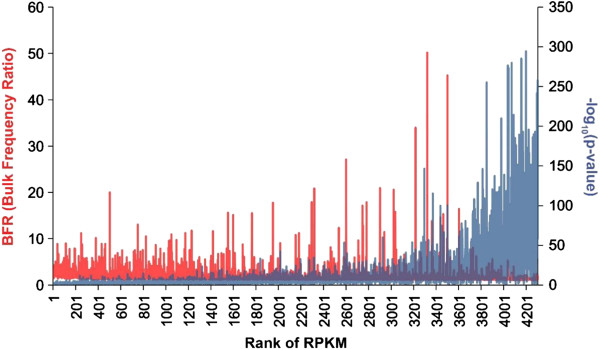
Results: In this study, we demonstrated the use of bulked segregant RNA-seq (BSR-Seq) for the analysis of differentially expressed genes and associated SNPs with disease resistance against enteric septicemia of catfish (ESC). A total of 1,255 differentially expressed genes were found between resistant and susceptible fish. In addition, 56,419 SNPs residing on 4,304 unique genes were identified as significant SNPs between susceptible and resistant fish. Detailed analysis of these significant SNPs allowed differentiation of significant SNPs caused by genetic segregation and those caused by allele-specific expression. Mapping of the significant SNPs, along with analysis of differentially expressed genes, allowed identification of candidate genes underlining disease resistance against ESC disease.

Conclusions: This study demonstrated the use of BSR-Seq for the identification of genes involved in disease resistance against ESC through expression profiling and mapping of significantly associated SNPs. BSR-Seq is applicable to analysis of genes underlining various performance and production traits without significant investment in the development of large genotyping platforms such as SNP arrays.


Figures

Figure 1
Figure 1
Volcano plot of genes differentially expressed between resistant and susceptible fish. The dots located in the positive area stand for genes expressed higher in resistant fish, and dots located in the negative area stand for genes expressed higher in susceptible fish. As shown in graphic symbol, different color were used to scale different expression fold changes; purple stands for expression fold changes higher than 100-fold; red stands for expression fold changes from 50–100 fold; light blue stands for expression fold changes from 10–50 fold; green stands for expression fold changes from 5–10 fold; blue stands for expression fold changes from 2–5 fold; and gray stands for gene expressed insignificantly (p-value > 0.05 or fold change smaller than 2).
Figure 2
Figure 2
Genes harbouring significant SNPs, plotted by the log2(BFR) versus rank of RPKM. Genes which have BFR larger than 16 (log2 =4) were highlighted by red and their gene names were labeled.
Figure 3
Figure 3
Genes harbouring significant SNPs, plotted by their combined allele ratios versus rank of RPKM. Red dots represent genes with BFR ≥ 4 and combined allele ratio ≤ 9; brown dots represent genes with BFR ≥ 4 and allele ratio ≥ 14; green dots represent genes with BFR < 4 and allele ratio ≥ 14, blue stands for genes with allele ratio from 9 to 14, or genes with BFR < 4 and allele ratio ≤ 9. The three threshold lines of combined allele ratio of 1:7 (maximal possible ratio at the DNA level for any polymorphic SNP with two families), 1:9 (3X maximal possible ratio at the DNA level for SNPs polymorphic in both families); and 1:14 (2X maximal possible ratio at the DNA level for any polymorphic SNP with two families) were drawn for references.
Figure 4
Figure 4
The distribution of high BFR genes (BFR ≥ 4) on linkage groups. Blue stands for the number of genes with 5 ≤ BFR < 10, red stands for the number of genes with BFR ≥ 10.
Figure 5
Figure 5
Distribution of genes containing SNPs of high BFR in linkage group 6.
Figure 6
Figure 6
Distribution of genes containing SNPs of high BFR in linkage group 15.
Figure 7
Figure 7
Distribution of genes containing SNPs of high BFR in linkage group 17.
Figure 8
Figure 8
Genes harbouring significant SNPs, plotted by their combined allele ratios versus the rank of RPKM. Red dots stand for genes with the preferentially expressed allele expressed higher in resistant group and their parental origin unknown; Solid red triangles stand for genes with the preferentially expressed allele expressed higher in resistant group and their parental origin being channel catfish; Unfilled red triangles stand for genes with the preferentially expressed allele expressed higher in susceptible group and their parental origin being channel catfish; Solid blue triangles stand for genes with the preferentially expressed allele expressed higher in resistant group and their parental origin being blue catfish; Unfilled blue triangles stand for genes with the preferentially expressed allele expressed higher in susceptible group and their parental origin being blue catfish; and green dots stand for genes with the preferentially expressed allele expressed higher in susceptible group and their parental origin unknown.
Figure 9
Figure 9
Relationship between RPKM, BFR and p-value. The BFR is shown on the left-Y axis (red) and P-values are shown on right-Y axis (blue), both against the rank of RPKM on X-axis. Note there is correlation between p-values and RPKM, but not the BFR.

Similar articles

Cited by

References

    1. Oleksiak MF, Roach JL, Crawford DL. Natural variation in cardiac metabolism and gene expression in Fundulus heteroclitus. Nat Genet. 2004;14:67–72. - PMC - PubMed
    1. Hallman D, Boerwinkle E, Saha N, Sandholzer C, Menzel H, Csazar A, Utermann G. The apolipoprotein E polymorphism: a comparison of allele frequencies and effects in nine populations. Am J Hum Genet. 1991;14:338. - PMC - PubMed
    1. He G, Chen B, Wang X, Li X, Li J, He H, Yang M, Lu L, Qi Y, Wang X. Conservation and divergence of transcriptomic and epigenomic variation in maize hybrids. Genome Biol. 2013;14:R57. doi: 10.1186/gb-2013-14-6-r57. - DOI - PMC - PubMed
    1. Bevan M, Uauy C. Genomics reveals new landscapes for crop improvement. Genome Biol. 2013;14:206. doi: 10.1186/gb-2013-14-6-206. - DOI - PMC - PubMed
    1. Young N. QTL mapping and quantitative disease resistance in plants. Annu Rev Phytopathol. 1996;14:479–501. doi: 10.1146/annurev.phyto.34.1.479. - DOI - PubMed

Publication types