. 2014 Jan 22;81(2):388-401.
doi: 10.1016/j.neuron.2013.10.054. Epub 2013 Dec 26.

Adaptation to background light enables contrast coding at rod bipolar cell synapses

Affiliations

Adaptation to background light enables contrast coding at rod bipolar cell synapses

Jiang-Bin Ke et al. Neuron. .

Abstract

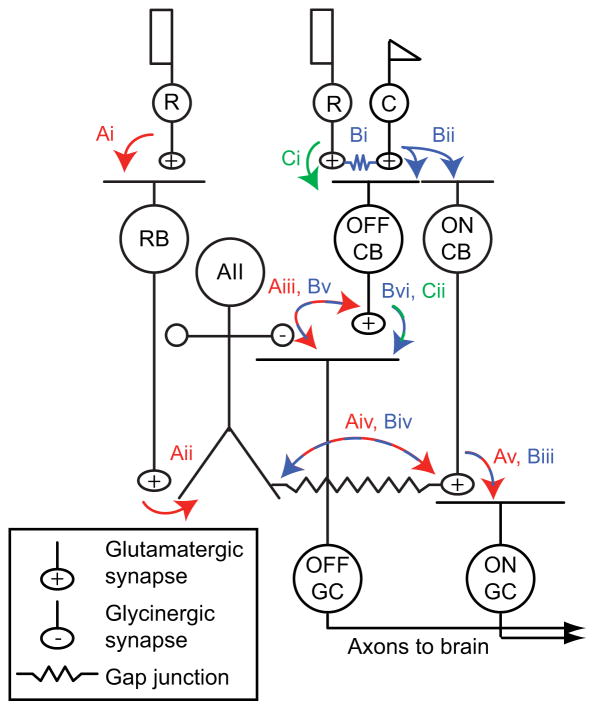
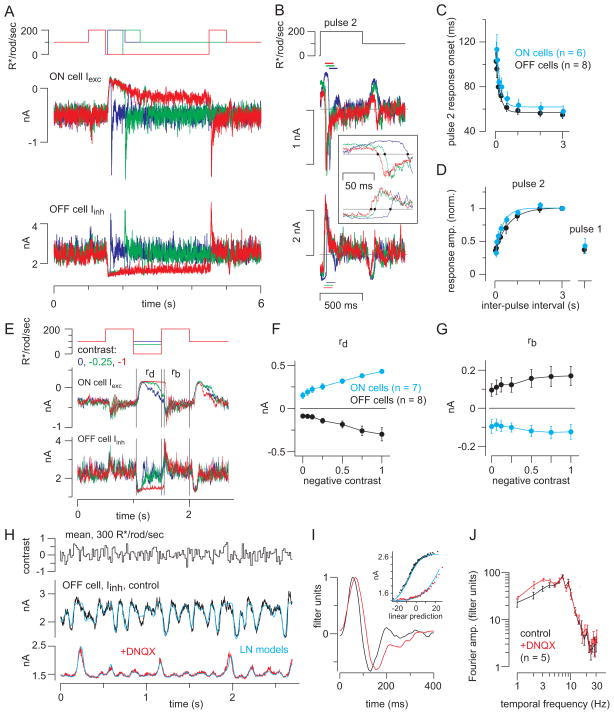
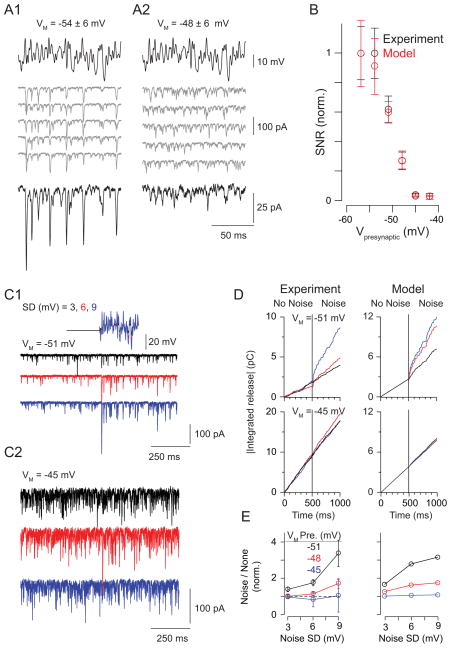
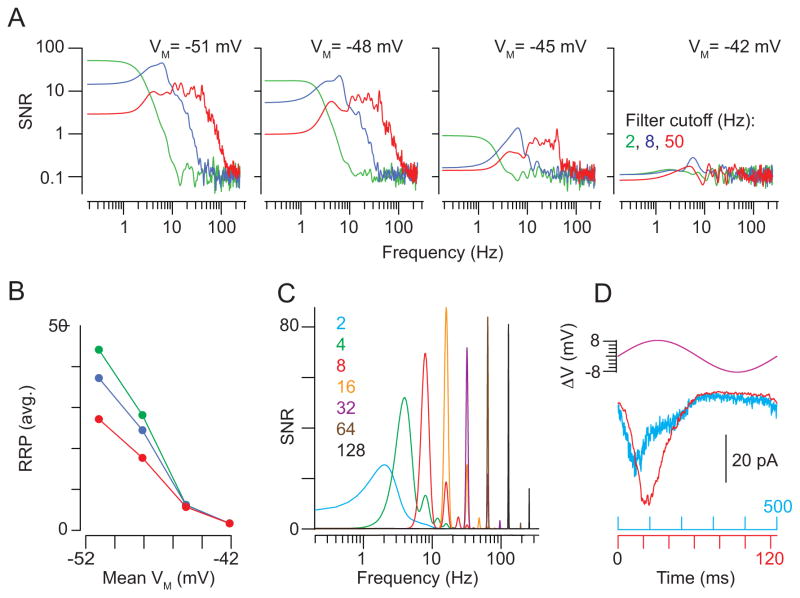
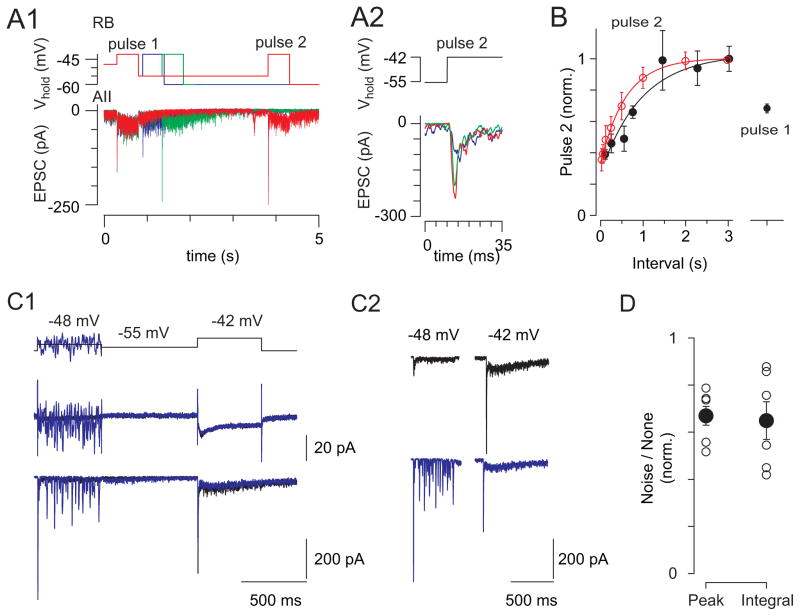
Rod photoreceptors contribute to vision over an ∼ 6-log-unit range of light intensities. The wide dynamic range of rod vision is thought to depend upon light intensity-dependent switching between two parallel pathways linking rods to ganglion cells: a rod → rod bipolar (RB) cell pathway that operates at dim backgrounds and a rod → cone → cone bipolar cell pathway that operates at brighter backgrounds. We evaluated this conventional model of rod vision by recording rod-mediated light responses from ganglion and AII amacrine cells and by recording RB-mediated synaptic currents from AII amacrine cells in mouse retina. Contrary to the conventional model, we found that the RB pathway functioned at backgrounds sufficient to activate the rod → cone pathway. As background light intensity increased, the RB's role changed from encoding the absorption of single photons to encoding contrast modulations around mean luminance. This transition is explained by the intrinsic dynamics of transmission from RB synapses.


Figures

Figure 1
Figure 1. Rod pathways in the mammalian retina
(A) In red: the rod bipolar (RB) pathway. Rods make synapses onto RBs (Ai), which make synapses onto AIIs (Aii). AIIs make glycinergic synapses (Aiii) onto the terminals of some OFF cone bipolar (CB) cells and onto the dendrites of some OFF ganglion cells (GCs). AIIs are coupled by electrical synapses to the terminals of ON CBs, which make glutamatergic synapses onto ON GCs (Av). The AMPAR antagonist DNQX blocks transmission from RBs to AIIs (Aii). (B) In blue: rods are coupled electrically to cones by gap junctions (Bi), and cones make synapses onto ON and OFF CBs (Bii). Depolarization of the ON CB by the cone not only drives glutamatergic transmission to ON GCs (Biii); it also depolarizes AIIs via the electrical synapse (Biv) and thereby elicits glycinergic transmission to OFF GCs and, perhaps, OFF CBs (Bv). Signaling from cones to OFF GCs via the AII (Bi→Bii→Biv→Bv) is preserved in the presence of DNQX. OFF CBs make glutamatergic synapses onto OFF GCs (Bvi). (C) In green: rods make direct chemical synapses onto some types of OFF CB (Ci), which in turn contact OFF GCs (Cii). Transmission through this pathway is blocked by DNQX.
Figure 2
Figure 2. Background light suppresses rod-mediated flash responses
(A) 10 ms flashes (at time 0) evoking 0.1 or 1 R*/rod (green light, 0.3-mm diameter) were presented on darkness or added to a background (100 R*/rod/s). Responses were measured in ON or OFF ganglion cells; OFF responses also were recorded in DNQX (100 μM). Vhold = −70 mV (ON cells) or 0 mV (OFF cells; 10 kHz sampling; 2 or 4 kHz Bessel filtering). Amplitudes were measured in a window 50–125 ms after flash onset (shaded region) after subtracting the baseline current (red line, measured over 500 ms prior to flash). (B) Intensity-response functions for flashes presented on darkness (black) or background (green). Responses were normalized to the response to the brightest flash from darkness before averaging across cells. Error bars: ±SEM. Lines show fitted sigmoidal equations that share amplitude (A) and exponent (q) values but have unique half-saturation constants (σ). ON cell parameters: A = 1.0, σdark = 0.31, σbackground = 6.5, q = 1.4; OFF cell parameters: A = 1.0, σdark = 0.088, σbackground = 5.3, q = 4.2; OFF cell in DNQX parameters: A = 2.2, σdark = 3.5, σbackground = 7.0, q = 1.3. OFF cell data with the background were better captured by an independent fit (dashed line): A = 0.082, σbackground = 0.56, q = 2.6. (C1) Background-subtracted responses to flashes (0.1 R*/rod, 1-mm diameter spot) before, during and after presentation of a background (100 R*/rod/s) for 30 seconds (green region). Responses were normalized to the average flash response before the background presentation. (C2) Baseline currents measured between the flash responses for the data in C1. (D) Responses to flashes of either green or UV light (200 ms, 1-mm diameter spot) presented on darkness in mice lacking either rod (Gnat1−/−) or cone (Gnat2−/−) function. Intensity is indicated below each trace (nW/mm2). Background-subtracted responses were measured over a window 20–220 ms after flash onset. (E) Intensity-response functions for data in D. Responses were normalized across cells before averaging by dividing by the response to the brightest green stimulus (Gnat2−/−; n = 2 ON cells, 2 OFF cells) or UV stimulus (Gnat1−/−; n = 5 ON cells). Error bars: ±SEM across cells. Gnat2−/− parameters: A = 1.2, σgreen = 0.0011, σUV = 0.0061, q = 0.92; Gnat1−/− parameters: A = 1.0, σgreen = 14.3, σUV = 0.61, q = 0.98. Dashed vertical line indicates the brightest green light used in the remainder of this study (−0.33 log10 nW/mm2, equivalent to ~600 R*/rod/s).Green light at this intensity did not elicit significant cone-mediated responses in the Gnat1−/− mice.
Figure 3
Figure 3. Ganglion cell responses to Michelson contrast depend on the rod → rod bipolar cell pathway
(A1) Responses to contrast modulation (100% contrast, 1 Hz) at a background of 2 R*/rod/s. Responses are shown for an ON GC and for an OFF GC in control conditions and in the presence of DNQX (100 μM). At right: averaged responses (average of 9 cycles, excluding the first). On responses (green) and Off responses (magenta) are points >1 SD of the baseline current (measured over 2 sec before contrast onset). Vhold = −70 mV (ON cells) or 0 mV (OFF cells; 10 kHz sampling; 2 or 4 kHz Bessell filtering). (A2) Same format and cells shown in A1 at a higher mean background. Averages of 4 cycles (excluding the first) are shown to the right of raw data. (B1) Averaged On and Off integrated responses from ON cells, normalized to the Off response at the 128 R*/rod/s background and multiplied by −1 to generate the same sign as for OFF cells in B2. Data include 7 cells recorded at 1–128 R*/rod/s (1-mm diameter spot) and 5 cells recorded at 2–256 R*/rod/s (0.3-mm diameter spot). Error bars: ±SEM across cells. (B2) Same format as B1 for OFF cells. Data for both control and DNQX conditions were normalized to the control response at the 128 R*/rod/s mean. Control data include 11 cells recorded at 1–128 R*/rod/s (1-mm diameter spot) and 5 cells recorded at 2–256 R*/rod/s (0.3-mm diameter spot). DNQX data include 5 cells recorded at levels 1–128 R*/rod/s (1-mm diameter spot) and 4 cells recorded at 2–256 R*/rod/s (0.3-mm diameter spot). (C) Responses to a number of contrast levels were observed across the range of backgrounds studied. A peak-to-peak response was calculated, from amplitudes measured as in B1, and normalized to the 100%-contrast response at the 256 R*/rod/s mean, before averaging across cells (n = 5; 0.3-mm diameter spot). Error bars: ±SEM across cells. (D) Average responses to one cycle of contrast modulation at means of either 1 or 128 R*/rod/s for ON cells in either Gnat1−/− or Gnat2−/− mice. (E) On and Off integrated responses (nA x ms) for ON cells in Gnat1−/− (n = 5) and Gnat2−/− mice (n = 5) and control cells (n = 7) recorded with the same stimulus (1-mm diameter). Integrated inward currents (On responses) are plotted upward and outward currents (Off responses) are plotted downward to match the conventions in part B. (F) OFF cell’s inhibitory currents recorded at two mean potentials under control conditions and in the presence of D-AP5 (100 μM).
Figure 4
Figure 4. AII amacrine cell responses to Michelson contrast depend on the rod → rod bipolar cell pathway
(A1) Responses to contrast modulation (100% contrast; 1 Hz) at background = 2 R*/rod/s. Responses in control conditions and in the presence of DNQX (100 μM) are shown. At right: averaged responses to one cycle. Same conventions as in Figure 3A. Vhold = −70 mV (10 kHz sampling; 2 kHz Bessell filtering). (A2) Same format and cell shown in A1 at a higher mean background. (B1) Average On and Off integrated responses in AIIs (n = 4; 0.3-mm diameter spot), normalized to the Off response at the 128 R*/rod/s background and multiplied by −1 to generate the same sign as in Figure 3B. OFF cell responses from Figure 3B2 are shown (shifted rightward) for comparison. Error bars: ±SEM across cells. (B2) Same format as B1 for AII cells and OFF ganglion cells recorded in the presence of DNQX (n = 4). (C) Baseline currents measured in AII cells (n = 4) relative to the baseline current measured under control conditions at the 2 R*/rod/s background. Error bars: ±SEM across cells. (D) Variance measured during the baseline currents shown in C. (E) Average cycle responses to contrast modulation at two mean luminances in an example AII cell measured under control conditions and in the presence of DNQX (100 μM) and DNQX + D-AP5 (100 μM). (F) Light-evoked currents are largely excitatory. Left: averaged responses to contrast modulation at the 256 R*/rod/s background were largely unaffected by blockade of postsynaptic GABAA (GABAzine, 20 μM) and GlyRs (strychnine, 2 μM; purple). Adding DNQX (100 μM) attenuated the response and made it biphasic (as in A2). Right: depolarizing the AII to Ecation reduced current amplitudes without affecting waveform, indicating that currents are largely excitatory and carried by cations. (G) Summary of data illustrated in (F) for n = 4 recorded AIIs. Currents were averaged over the windows illustrated by green and red bars in (F).
Figure 5
Figure 5. Periods of darkness facilitate synaptic transmisison during subsequent responses to light
(A) Ganglion cell responses to two light pulses (500 ms) separated by variable periods of darkness (30 ms – 3 s). The example illustrates intervals of 60, 500, and 3000 ms (blue, green and red). Vhold = −70 mV (ON cells) or 0 mV (OFF cells; 10 kHz sampling; 4 kHz Bessell filtering). (B) Responses to the second pulse were background subtracted and aligned to pulse onset. Inset: systematic change in response onset as a function of inter-pulse interval; dots show the time when the response crossed the baseline (gray line). Colors indicate inter-pulse interval, as shown in (A). Response amplitude was quantified over a 100-ms window, starting at the time when the response crossed the baseline (dashed lines). (C) Response onset (see inset in B) became faster with longer inter-pulse intervals. Error bars: ±SEM across cells. Data from ON cells were shifted rightward slightly (30 ms) for visualization purposes (similar shift in part D). Fitted exponential functions are shown for ON (τ = 180 ms) and OFF cells (τ = 175 ms). (D) The pulse 2 response increased with inter-pulse interval. Responses were normalized to the response following the 3-s inter-pulse interval. Pulse 2 responses (leak-subtracted) were measured over a 100-ms window following the determined onset time (see B., inset). The pulse 1 response was measured over a 100-ms window starting 40-ms after pulse onset. Fitted exponential functions are shown for ON (τ = 336 ms) and OFF cells (τ = 606 ms). (E) Different negative contrasts were interspersed between two bright pulses. Background-subtracted responses were measured within windows indicated for the response to dark pulse (rd) and the second bright pulse (rb). (F) The response to dark (outward current in ON cells, inward current in OFF cells) increased with contrast level. Error bars: ±SEM across cells. (G) The response to the second light pulse was nearly the same following different negative contrasts. (H) Response to repeated white-noise stimulation (average of 10 repeats) in OFF ganglion cell inhibitory currents, before and after adding DNQX to block the RB-AII synapse. Cyan lines show the fits from linear-nonlinear (LN) models. (I) LN models in control (black) and DNQX (red) conditions. Adding DNQX caused a slight delay in the filter (normalized to a peak of one) and a reduction in the range of the nonlinearity (Inset). (J) Fourier amplitude of the normalized filters in control and DNQX conditions across cells (n = 5 OFF cells). Band-pass filtering is similar in the two conditions. Error bars: ±SEM across cells. Frequencies plotted are 1–10 Hz and even frequencies between 10 and 20 Hz; data in the DNQX condition were shifted rightward slightly for visualization purposes.
Figure 6
Figure 6. SNR at the RB→AII synapse declines with presynaptic depolarization
(A) Paired recordings performed at mean presynaptic VM = −54 mV (A1) or −48 mV (A2).Individual responses are illustrated as gray traces; the average responses are black. Note that depolarization to −48 mV increased synaptic activity uncorrelated with the stimulus (gray) and reduced the amplitude of correlated responses (i.e., the average response). (B) Measured SNR plotted as a function of mean presynaptic VM (black). For each cell pair, SNR was normalized to the maximum observed in that pair (error bars: ± SEM). Overlaid in red is the relationship between SNR and mean VM predicted by a phenomenological model of synaptic transmission (error bars: ± SD) (C) Noise increased release at hyperpolarized potentials. EPSCs recorded in AIIs when the presynaptic RB was clamped at −51 mV (C1) or −45 mV (C2) with or without noise (SD = 3,6, or 9 mV; black, red, and blue, respectively). (D) Noise increases release (measured as the integral of the postsynaptic current) at VM = −51 mV but not −45 mV (left); this was predicted by the model of the synapse (right). (E) Summary of the effect of noise on tonic release. Membrane noise enhanced release significantly at hyperpolarized potentials at which the RRP is not depleted.
Figure 7
Figure 7. Assessing the stimulus voltage- and frequency-dependence of SNR at the RB→AII synapse
(A) A simulation was used to probe the relationship between presynaptic VM and the SNR of transmission. From left to right, SNR (i.e., signal power/averaged noise power) as a function of frequency at varying simulated holding potentials: the model synapse was driven with stimuli (mean VM ± 6 mV) filtered at cut-off frequencies of 2, 8, and 50 Hz (green, blue, and red, respectively). SNR was affected by filter frequency at hyperpolarized but not depolarized VM. (B) Readily-releasable vesicles in the simulated presynaptic pool plotted as a function of VM: at hyperpolarized, but not depolarized VM, long-lasting hyperpolarizations permit recovery of the RRP. This phenomenon underlies the frequency-dependence of SNR illustrated in (D). (C) The SNR of the synapse was assessed using pure sine-wave stimuli at frequencies between 2 and 128 Hz (VM = −48±6 mV). SNR increased with frequency in the 2–16 Hz range. (D) A comparison of simulated responses to 2 and 8 Hz sine-waves illustrates the mechanism underlying the increase in SNR. During a slow (2 Hz) depolarization, RRP depletion occurs before the depolarizing voltage excursion is completed (cyan). Therefore, the response is not well-correlated with the entirety of the stimulus. This is not the case for the response to the 8-Hz stimulus (red).
Figure 8
Figure 8. Hyperpolarization enables contrast coding at the RB→AII synapse
(A1) During paired recording of a coupled RB and AII, paired pulses (500 ms) to −42 mV from −48 mV, separated by a variable interval (here, 100, 550, and 3020 ms) at −55 mV to mimic darkness, were delivered to the RB; EPSCs were recorded in the AII (n = 10 paired recordings). (A2) The latencies of the EPSCs recorded in the AII were not dependent on the duration of the hyperpolarization. (B) The ratio of the second response to the first (paired pulse ratio; PPR) increased with inter-pulse interval (PPR normalized to PPR at the longest interval; the time constant of the exponential fit to the data is ~900 ms). Recovery from depression is largely complete by the 1.4 s interval. Superimposed in red are the data from Figure 5D illustrating the time course of the recovery of Iinh recorded in OFF GCs. (C) Noise depresses subsequent responses to a voltage step. (C1) The RB is clamped at −48 mV without (black) and with noise (blue; SD = 9 mV) and then at −55 mV before a test pulse to −42 mV. Here, RB currents are not leak-subtracted. The noise increased release during the first pulse, P1, thereby decreasing release evoked by the test pulse, P2. Responses are shown again for clarity in (C2). (D) Summary data for n = 5 paired recordings (error bars: ±SEM). The peak and the integral of the second response were decreased following the noisy prepulse (to 67 and 65% of control, peak and integral, respectively; P < 0.05 for both by paired t-test).

References

    1. Anderson JR, Jones BW, Watt CB, Shaw MV, Yang JH, Demill D, Lauritzen JS, Lin Y, Rapp KD, Mastronarde D, et al. Exploring the retinal connectome. Molecular vision. 2011;17:355–379. - PMC - PubMed
    1. Applebury ML, Antoch MP, Baxter LC, Chun LL, Falk JD, Farhangfar F, Kage K, Krzystolik MG, Lyass LA, Robbins JT. The murine cone photoreceptor: a single cone type expresses both S and M opsins with retinal spatial patterning. Neuron. 2000;27:513–523. - PubMed
    1. Arman AC, Sampath AP. Dark-adapted response threshold of OFF ganglion cells is not set by OFF bipolar cells in the mouse retina. Journal of neurophysiology. 2012;107:2649–2659. - PMC - PubMed
    1. Armstrong-Gold CE, Rieke F. Bandpass filtering at the rod to second-order cell synapse in salamander (Ambystoma tigrinum) retina. The Journal of neuroscience: the official journal of the Society for Neuroscience. 2003;23:3796–3806. - PMC - PubMed
    1. Beaudoin DL, Manookin MB, Demb JB. Distinct expressions of contrast gain control in parallel synaptic pathways converging on a retinal ganglion cell. The Journal of physiology. 2008;586:5487–5502. - PMC - PubMed

Publication types

MeSH terms