. 2014 Jan 16;6(1):81-92.
doi: 10.1016/j.celrep.2013.12.001. Epub 2013 Dec 27.

BET bromodomain inhibition triggers apoptosis of NF1-associated malignant peripheral nerve sheath tumors through Bim induction

Affiliations

BET bromodomain inhibition triggers apoptosis of NF1-associated malignant peripheral nerve sheath tumors through Bim induction

Amish J Patel et al. Cell Rep. .

Abstract

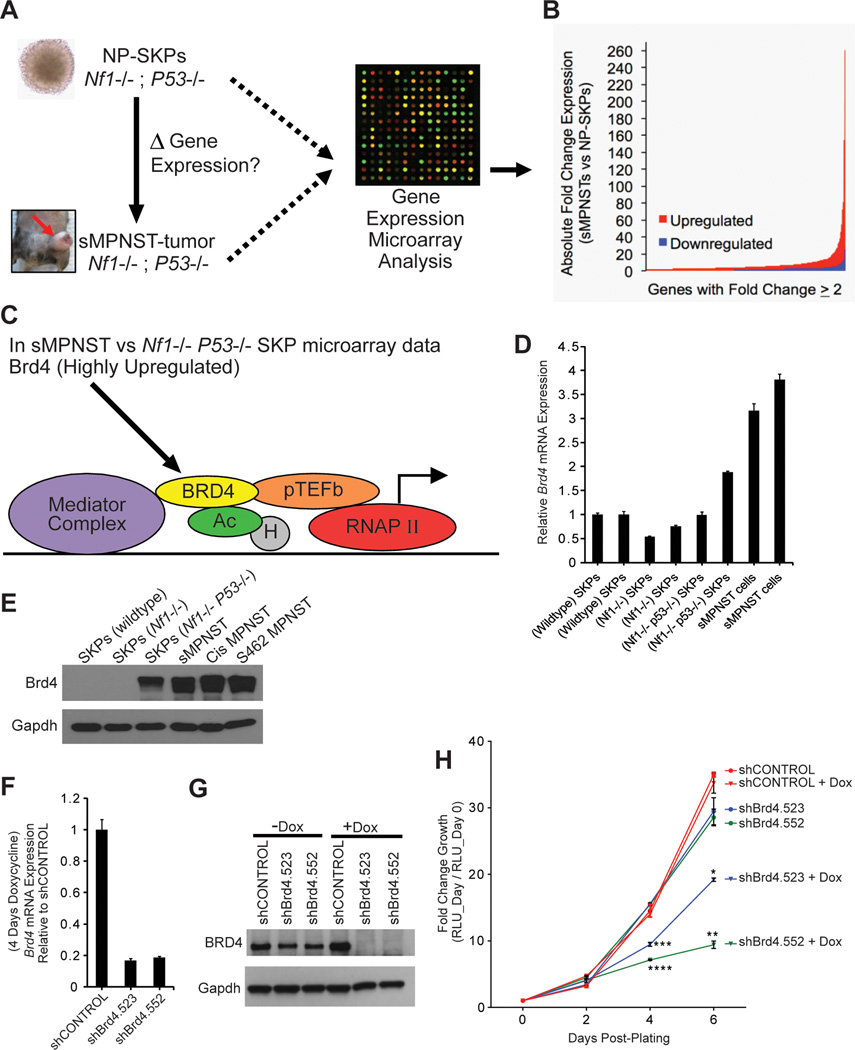
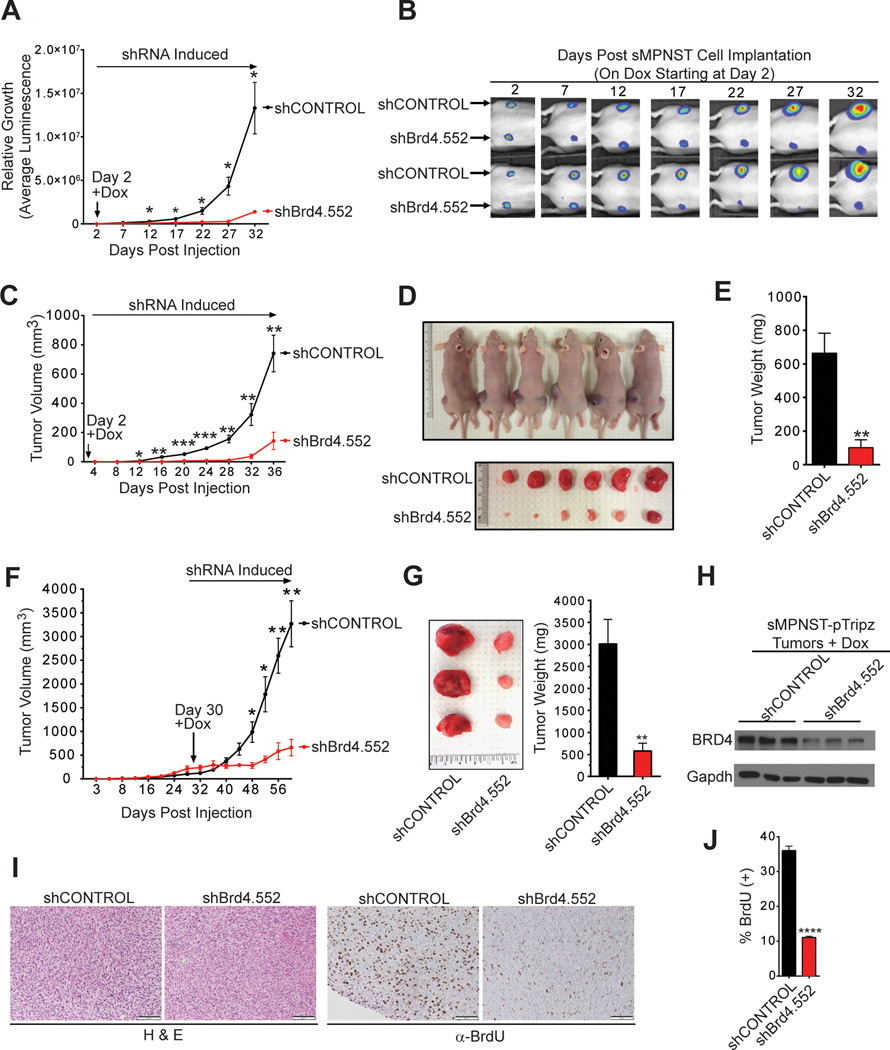
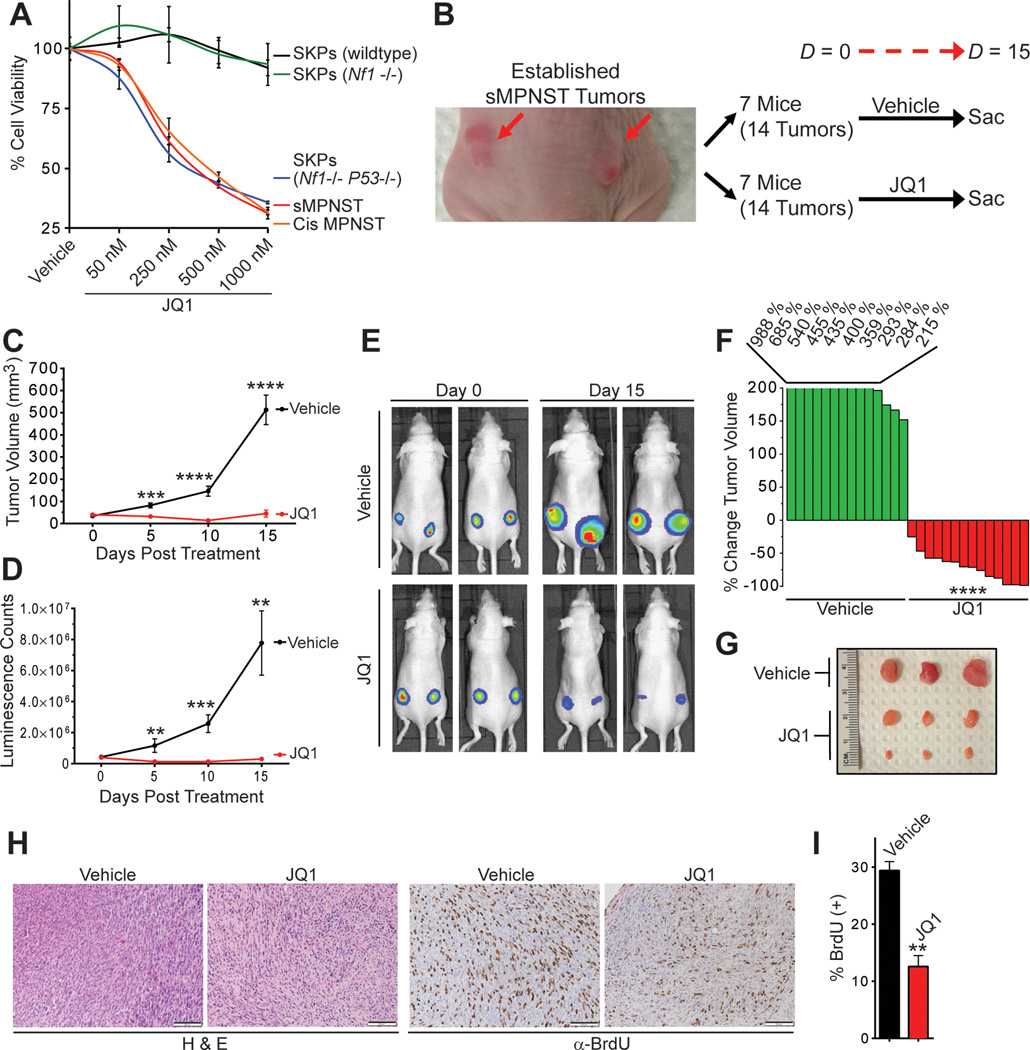
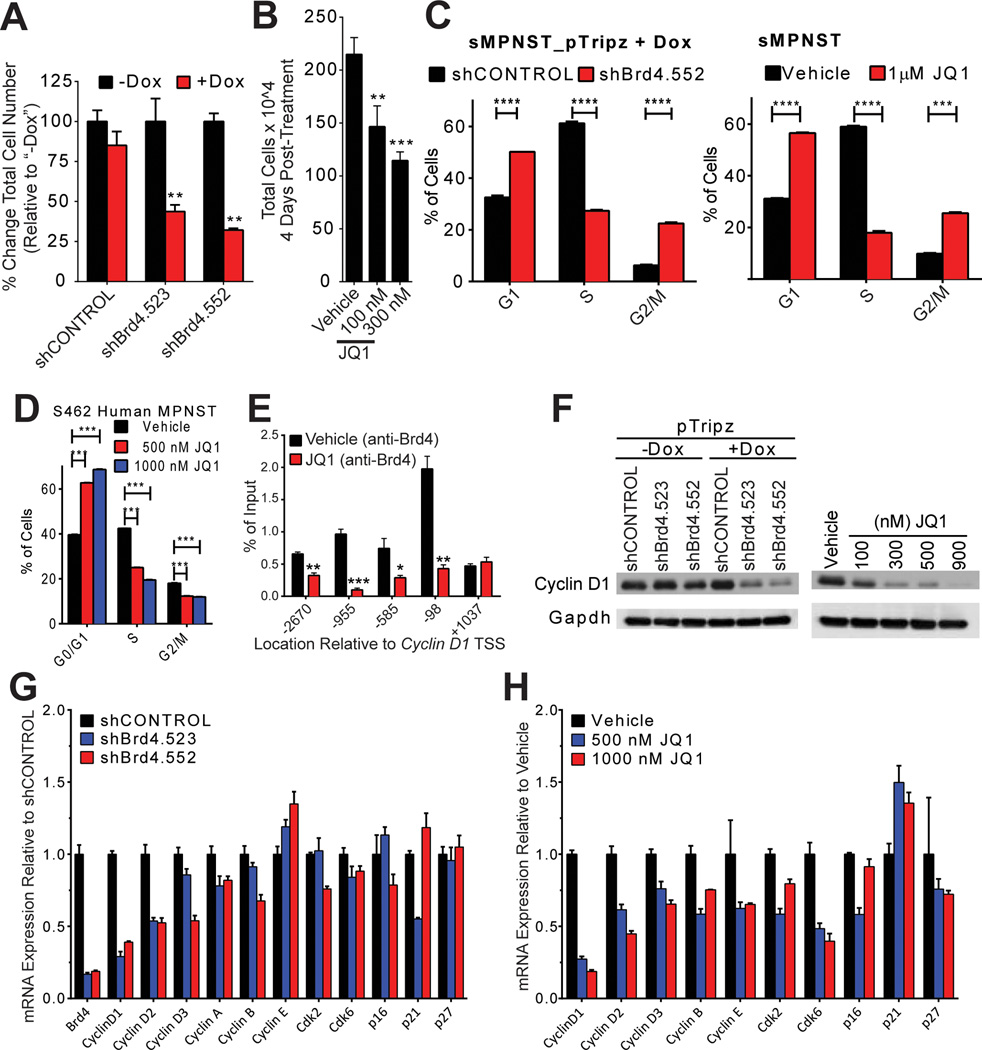
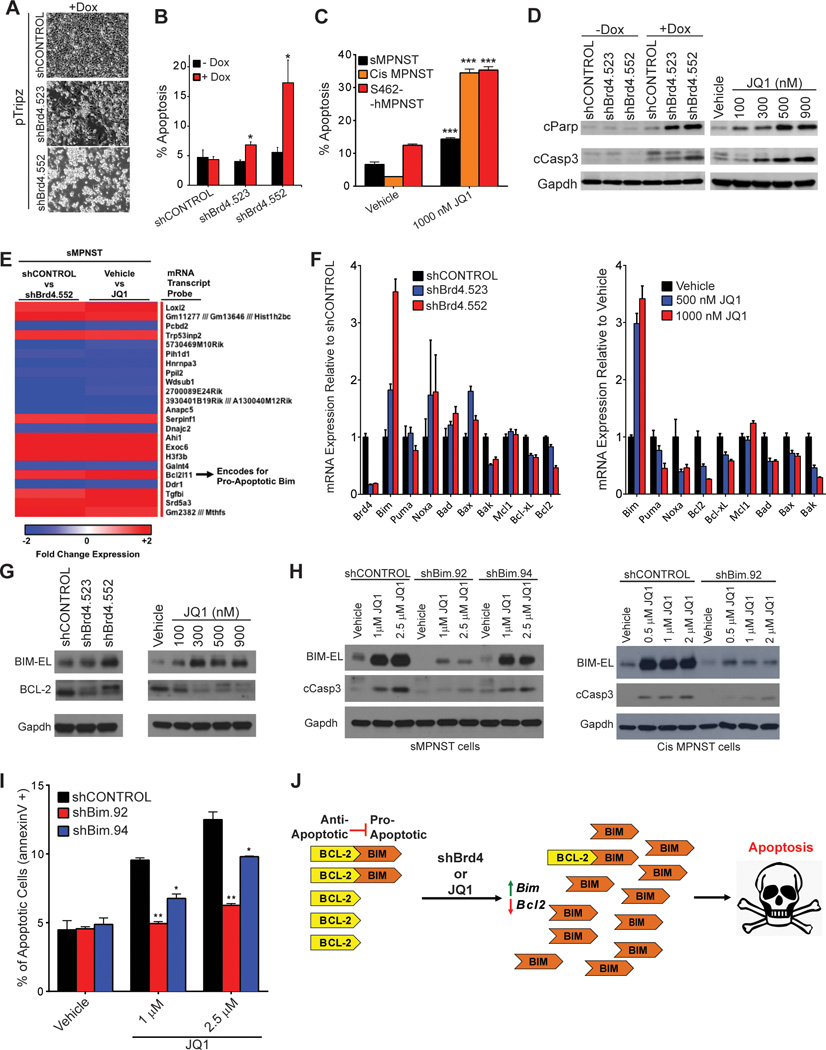
Malignant peripheral nerve sheath tumors (MPNSTs) are highly aggressive sarcomas that develop sporadically or in neurofibromatosis type 1 (NF1) patients. There is no effective treatment for MPNSTs and they are typically fatal. To gain insights into MPNST pathogenesis, we utilized an MPNST mouse model that allowed us to study the evolution of these tumors at the transcriptome level. Strikingly, in MPNSTs we found upregulation of a chromatin regulator, Brd4, and show that BRD4 inhibition profoundly suppresses both growth and tumorigenesis. Our findings reveal roles for BET bromodomains in MPNST development and report a mechanism by which bromodomain inhibition induces apoptosis through induction of proapoptotic Bim, which may represent a paradigm shift in therapy for MPNST patients. Moreover, these findings indicate epigenetic mechanisms underlying the balance of anti- and proapoptotic molecules and that bromodomain inhibition can shift this balance in favor of cancer cell apoptosis.


Figures

Figure 1
Figure 1. Identification of Brd4 Upregulation and Roles in MPNSTs
(A) Diagram of microarray experiment for transcriptome analysis. (B) Bar graph representation of the absolute fold change in expression of all genes from microarray experiment with fold change of ≥ 2. (C) Pictorial representation of positive regulators of transcriptional elongation by RNA polymerase II, and identification of Brd4 upregulation in MPNSTs (from microarray experiment). (D and E) qRT-PCR and Western blot analysis of MPNST cells and precursors for expression of Brd4. (F and G) qRT-PCR and Western blot analysis for Brd4 knockdown in sMPNST-pTripz cells with or without doxycycline (Dox). (H) Effect of Brd4 shRNA induction on MPNST cell growth/viability using ATP CellTiter Glo assay. All statistics are represented as the mean +/− SEM (*p < 0.05, **p ≤ 0.01, ***p ≤ 0.001, ***p ≤ 0.0001).
Figure 2
Figure 2. BRD4 Maintains Tumorigenic Capacity of MPNSTs In Vivo
(A) Growth of shCONTROL and shBrd4.552 sMPNST tumors relative to “Day 2” value. Values represent luminescence counts (tumor bioluminescence imaging, n = 6 tumors per group). (B) Representative pictures of sMPNST tumor bioluminescence in mice over time, which indicate that acute Brd4 knockdown suppresses MPNST tumorigenesis in vivo. Mice were started on doxycycline water on day 2, and kept on this treatment until the end of the experiment. (C) sMPNST tumor volume measurements (each data point represents the average measurement from 6 different tumors per group). (D) Top panel: Mice at 36 days post-subcutaneous implantation of sMPNST tumor cells (shCONTROL on left flank and shBrd4.552 on right flank). Bottom panel: Tumors excised from mice in “Top panel”. (E) Average weight of excised tumors from bottom panel of Figure 3D. (F) Tumor volume of shCONTROL and shBrd4.552 sMPNST-pTripz tumors in mice. At day 30, when tumors were established (200–400 mm3), mice were started on doxycycline water. (G) Representative picture and average weight of excised sMPNST tumors from end of experiment in Figure 3F. (H) Western blot analysis of BRD4 protein levels in shCONTROL and shBrd4.552 sMPNST tumors in mice given doxycycline water. (I) Representative images of sMPNST tumor sections stained with either hematoxylin and eosin (H&E) or BrdU antibody. (J) Quantification of the percentage of BrdU(+) cells from sMPNST tumor sections (scale bars represent 100 µm). All statistics are represented as the mean +/− SEM (*p ≤ 0.05, **p ≤ 0.01, ***p ≤ 0.001, ***p ≤ 0.0001).
Figure 3
Figure 3. JQ1 Induces MPNST Regression In Vivo
(A) Dose response curves for 2 day JQ1 treatment on primary murine SKPs (wildtype, Nf1−/−, Nf1−/− P53−/−) and MPNST cells (SKP model and cisNP model). ATP CellTiter-glo assay was used to measure cell viability, and normalized to DMSO (Vehicle) for each cell type. (B) Overview of JQ1 drug trial with nude mice bearing sMPNST allografts. (C) Average sMPNST tumor volume measured during JQ1 drug trial (n = 14 tumors per treatment group). (D) Average sMPNST tumor bioluminescence counts measured during JQ1 drug trial (n = 14 tumors per treatment group). (E) Bioluminescence imaging of sMPNST allografts in mice before and after the JQ1 drug trial. (F) Waterfall plot showing the percentage change in sMPNST tumor volume from before starting (Day 0) and after 10 days of JQ1 treatment. (G) Representative pictures of sMPNST allografts excised from mice treated with vehicle or JQ1 for 15 days. (H) Staining of sections from sMPNST allografts (vehicle or JQ1 treated) with hematoxylin and eosin (H&E) or immunostaining with BrdU antibody. (I) Quantification of BrdU(+) cells from vehicle and JQ1 treated sMPNST tumor sections (scale bars represent 100 µm). All statistics are represented as the mean +/− SEM (*p ≤ 0.05, **p ≤ 0.01, ***p ≤ 0.001, ***p ≤ 0.0001).
Figure 4
Figure 4. BRD4 Maintains CyclinD1 Expression and Cell Cycle Progression in MPNSTs
(A) sMPNST cells harboring doxycycline (Dox) inducible shRNAs were counted after 5 days culture (+ or − Dox) and normalized to cell count of “−Dox” cells. (B) sMPNST cells were counted 4 days after culturing in the presence of vehicle (DMSO) or JQ1. (C) sMPNST cells were harvested 4 days after Brd4 shRNA induction or 3 days after JQ1 treatment for processing, and subsequent analysis of BrdU uptake and DNA content by flow cytometry to determine the percentage of cells in the indicated cell cycle phases. (D) Cell cycle analysis of 48 hour treated S462 cells through flow cytometry for BrdU(+) cells and DNA content (PI). (E) sMPNST cells treated 24 hours with vehicle or 1000 nM JQ1 were harvested for chromatin immunoprecipitation (ChIP)-PCR analysis at different regions relative to Cyclin D1 transcription start site (TSS). (F) Western blot analysis of Cyclin D1 protein levels in sMPNST cells with Brd4 knockdown or JQ1 treatment. (G and H) qPCR analysis of cell cycle regulatory genes in sMPNST cells with Brd4 knockdown or JQ1 treatment respectively. All statistics are represented as the mean +/− SEM (*p ≤ 0.05, **p ≤ 0.01, ***p ≤ 0.001, ***p ≤ 0.0001).
Figure 5
Figure 5. BET Bromodomain Inhibition Triggers MPNST Apoptosis Through Bim Induction
(A) Microscopy images of sMPNST cells after 5 days of shRNA induction in vitro. (B) Percentage apoptosis in sMPNST cells with and without Brd4 shRNA induction (5 Days) by flow cytometry analysis of Annexin V (+) cells. (C) Apoptosis induction by 3 days of JQ1 treatment in mouse and human MPNSTs cells through flow cytometry analysis for Annexin V (+) cells. (D) Western blot analyses of lysates from sMPNST cells with (3 days) Brd4 knockdown or (2 days) JQ1 treatment for activation of apoptosis (cCasp3 = cleaved caspase 3, cParp = cleaved Parp). (E) Expression microarray analysis comparing the effect of Brd4 shRNA or JQ1 on sMPNST cells reveals induction of proapoptotic effector Bim. (F) qPCR analysis of the effect of (3 days) Brd4 shRNA or (2 days) JQ1 treatment on the expression of apoptosis regulators in sMPNST cells. (G) Western blot validation of BIM induction and BCL-2 down-regulation through Brd4 shRNA (3 days) or JQ1 (2 days) treatment in sMPNST cells. (H) Western blot analysis of BIM knockdown leading to attenuation of cleaved caspase 3 in sMPNST and Cis MPNST cells treated with JQ1 (2 days). (I) Flow cytometry analysis of Annexin V (+) cells reveals attenuated apoptosis through Bim shRNAs in sMPNST cells treated with JQ1 for 4 days. (J) Model for how BET bromodomain inhibition modulates the ratio of pro-apoptotic and anti-apoptotic molecules in favor of apoptosis. All statistics are represented as the mean +/− SEM (*p ≤ 0.05, **p ≤ 0.01, ***p ≤ 0.001, ***p ≤ 0.0001).

Similar articles

Cited by

References

    1. Albers AC, Gutmann DH. Gliomas in patients with neurofibromatosis type 1. Expert Review of Neurotherapeutics. 2009;9:535–539. - PubMed
    1. Albritton K, Rankin C, Coffin C, Ratner N, Budd G, Schuetze S, Randall R, Declue J, Borden E. Phase II study of erlotinib in metastatic or unresectable malignant peripheral nerve sheath tumors (MPNST) Journal of Clinical Oncology. 2006;24:9518.
    1. Bajenaru ML, Hernandez MR, Perry A, Zhu Y, Parada LF, Garbow JR, Gutmann DH. Optic Nerve Glioma in Mice Requires Astrocyte Nf1 Gene Inactivation and Nf1 Brain Heterozygosity. Cancer Research. 2003;63:8573–8577. - PubMed
    1. Bean GR, Ganesan YT, Dong Y, Takeda S, Liu H, Chan PM, Huang Y, Chodosh LA, Zambetti GP, Hsieh JJ-D, et al. PUMA and BIM Are Required for Oncogene Inactivation-Induced Apoptosis. Sci Signal. 2013;6 ra20- - PMC - PubMed
    1. Biernaskie JA, McKenzie IA, Toma JG, Miller FD. Isolation of skin-derived precursors (SKPs) and differentiation and enrichment of their Schwann cell progeny. Nat Protocols. 2007;1:2803–2812. - PubMed

Publication types

MeSH terms

Associated data