Comparative Study
. 2014 Mar;12(2):376-86.
doi: 10.1016/j.scr.2013.11.010. Epub 2013 Dec 4.

Comparison of the molecular profiles of human embryonic and induced pluripotent stem cells of isogenic origin

Affiliations
Comparative Study

Comparison of the molecular profiles of human embryonic and induced pluripotent stem cells of isogenic origin

Barbara S Mallon et al. Stem Cell Res. 2014 Mar.

Abstract

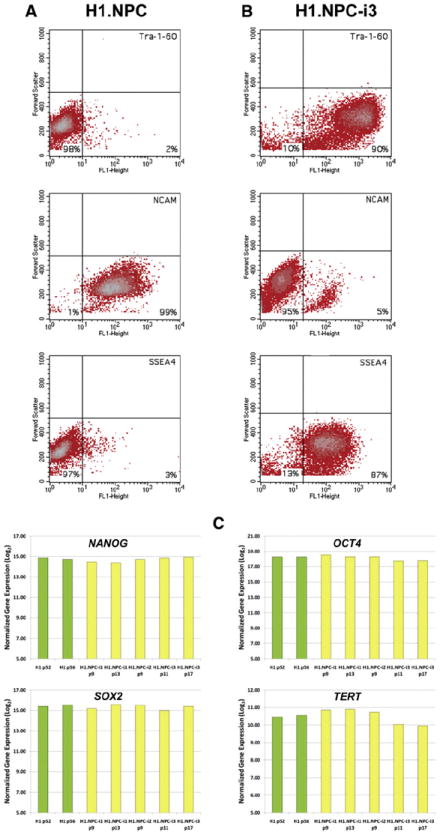
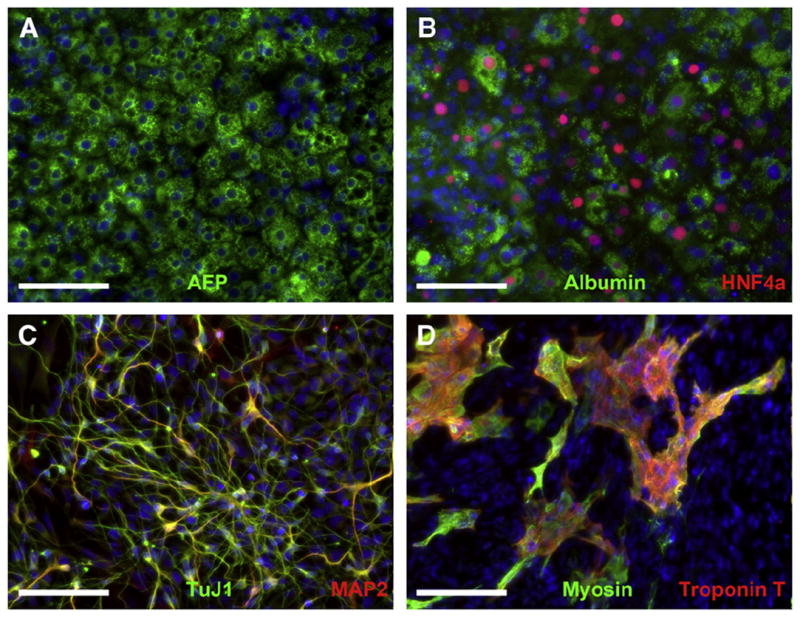
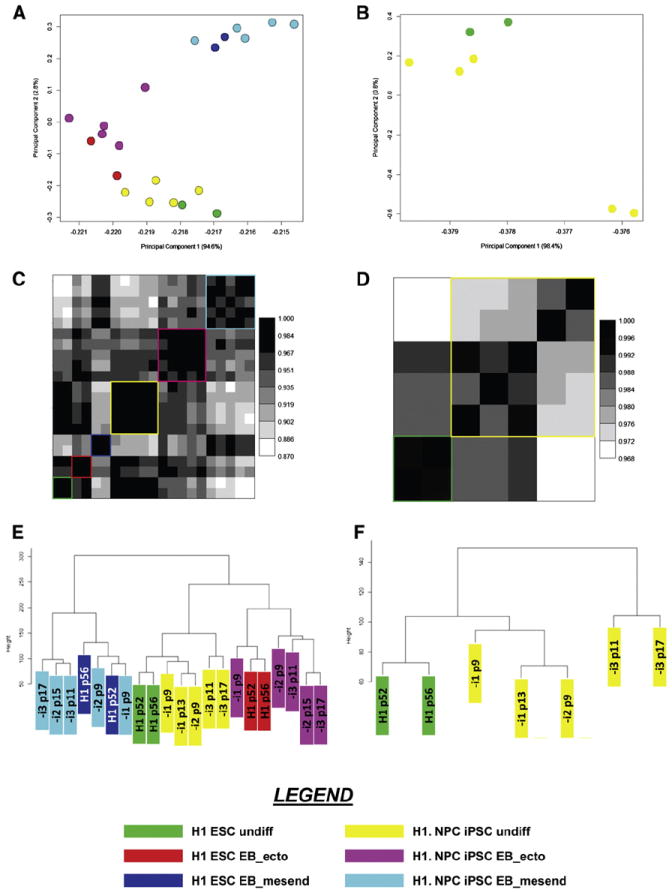
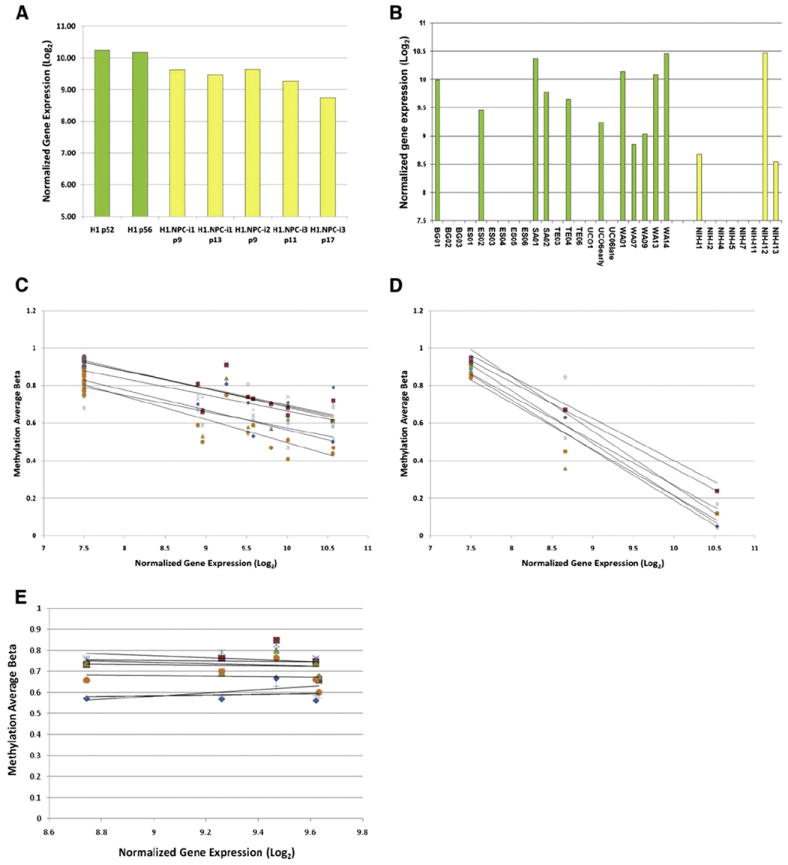
Many studies have compared the genetic and epigenetic profiles of human induced pluripotent stem cells (hiPSCs) to human embryonic stem cells (hESCs) and yet the picture remains unclear. To address this, we derived a population of neural precursor cells (NPCs) from the H1 (WA01) hESC line and generated isogenic iPSC lines by reprogramming. The gene expression and methylation profile of three lines were compared to the parental line and intermediate NPC population. We found no gene probe with expression that differed significantly between hESC and iPSC samples under undifferentiated or differentiated conditions. Analysis of the global methylation pattern also showed no significant difference between the two PSC populations. Both undifferentiated populations were distinctly different from the intermediate NPC population in both gene expression and methylation profiles. One point to note is that H1 is a male line and so extrapolation to female lines should be cautioned. However, these data confirm our previous findings that there are no significant differences between hESCs and hiPSCs at the gene expression or methylation level.


Figures

Figure 1
Figure 1
Characterization of the intermediate neural precursor (NPC) population and iPSCs. A and B) FACS analysis, represented by density plots of fluorescence intensity vs. forward scatter; A) Analysis of the intermediate neural precursor line, H1.NPC, shows the cells to be negative for the pluripotent stem cell markers, SSEA4 and Tra-1-60, and positive for the neural marker, polysialic neural cell adhesion molecule (NCAM). B) Analysis of the induced pluripotent stem cell line, H1.NPC-i3, shows the cells to be positive for SSEA4 and Tra-1-60 and negative for NCAM. C) Gene expression microarray analysis of NANOG, OCT4, SOX2 and TERT in H1 cells and derivatives showing similar levels of expression (log2 transformed quantile normalized) in both hESCs and hiPSCs. Embryonic stem cell samples are shown in green and iPSCs in yellow.
Figure 2
Figure 2
In vitro pluripotency assays for iPSC line, H1.NPC-i3. A & B) Endoderm differentiation – A) Directed differentiation generates cells positive for the hepatocyte markers, albumin (green) and HNF4α (red) as well as for alpha-fetoprotein (AFP) in B). C) Ectoderm differentiation – Neurons derived from H1.NPC-i3 are immunopositive for TuJ1 (green) with many MAP-2 positive cells (red). D) Mesoderm differentiation-cardiomyocytes are immunopositive for myosin heavy chain (green) and Troponin T (red). Note: Beating cardiomyocytes, indicative of mesoderm differentiation can also be viewed in Supplementary Video 1. Scale bar = 100 μm.
Figure 3
Figure 3
Gene expression array analysis. For all panels, log2 transformed quantile normalized Agilent expression values for a set of 38,449 gene probes, representing all probes expressed above noise, were used. Color-coding is uniform across all panels and is explained in the legend. H1 ESC undiff – green; H1.NPC iPSC undiff – yellow; H1 ESC EB_ecto – red; H1.NPC iPSC EB_ecto – magenta; H1 ESC EB_mesend – blue; H1.NPC iPSC EB_mesend – cyan. (A & B) Covariance PCA Scatterplot. A) 21 undifferentiated and differentiated samples. The x-axis describes the percent total variance explained by the first principal component (94.6%). The y-axis describes the percent total variance explained by the second principal component (2.8%). B) 7 undifferentiated samples. The x-axis describes the percent total variance explained by the first principal component (98.4%). The y-axis describes the percent total variance explained by the second principal component (0.8%). (C & D) Pearson Correlation Heat Map. C) Map depicts 21 undifferentiated and differentiated samples. D) Map depicts 7 undifferentiated samples. (E & F) Hierarchical Cluster Dendrogram. E) Dendrogram depicts 21 undifferentiated and differentiated samples. F) Dendrogram depicts 7 undifferentiated samples. For all images, the statistical programming language R was used (www.http://www.r-project.org/).
Figure 4
Figure 4
Regulation of NNAT gene expression. A) NNAT gene expression in H1 and derivatives shows little variation in isogenic pluripotent stem cell populations. B) NNAT gene expression in 21 genetically unique hESC and 8 hiPSC lines (StemCellDB) showing variability in expression levels. For both A) and B), undifferentiated hESCs are shown in green and hiPSCs in yellow. (C and D) Gene expression of NNAT in StemCellDB samples is reduced with increasing methylation but the decrease in expression is more profound in hiPSCs (C) than in hESCs (D). E) Isogenic H1 hiPSCs show little effect of methylation.

References

    1. Bock C, Kiskinis E, Verstappen G, Gu H, Boulting G, Smith ZD, Ziller M, Croft GF, Amoroso MW, Oakley DH, et al. Reference maps of human ES and iPS cell variation enable high-throughput characterization of pluripotent cell lines. Cell. 2011;144:439–452. - PMC - PubMed
    1. Chin MH, Mason MJ, Xie W, Volinia S, Singer M, Peterson C, Ambartsumyan G, Aimiuwu O, Richter L, Zhang J, et al. Induced pluripotent stem cells and embryonic stem cells are distinguished by gene expression signatures. Cell Stem Cell. 2009;5:111–123. - PMC - PubMed
    1. Deng J, Shoemaker R, Xie B, Gore A, LeProust EM, Antosiewicz-Bourget J, Egli D, Maherali N, Park IH, Yu J, et al. Targeted bisulfite sequencing reveals changes in DNA methylation associated with nuclear reprogramming. Nat Biotechnol. 2009;27:353–360. - PMC - PubMed
    1. Doi A, Park IH, Wen B, Murakami P, Aryee MJ, Irizarry R, Herb B, Ladd-Acosta C, Rho J, Loewer S, et al. Differential methylation of tissue- and cancer-specific CpG island shores distinguishes human induced pluripotent stem cells, embryonic stem cells and fibroblasts. Nat Genet. 2009;41:1350–1353. - PMC - PubMed
    1. Ebert AD, Yu J, Rose FF, Jr, Mattis VB, Lorson CL, Thomson JA, Svendsen CN. Induced pluripotent stem cells from a spinal muscular atrophy patient. Nature. 2009;457:277–280. - PMC - PubMed

Publication types