Review
. 2014 Jan 20;59(2):R65-R127.
doi: 10.1088/0031-9155/59/2/R65. Epub 2013 Dec 30.

High-field small animal magnetic resonance oncology studies

Affiliations
Review

High-field small animal magnetic resonance oncology studies

Louisa Bokacheva et al. Phys Med Biol. .

Abstract

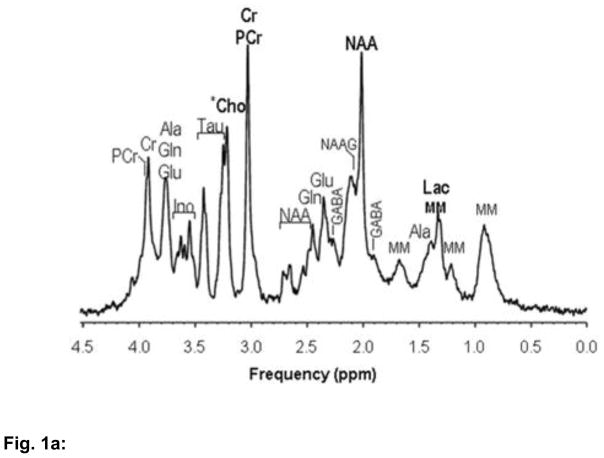
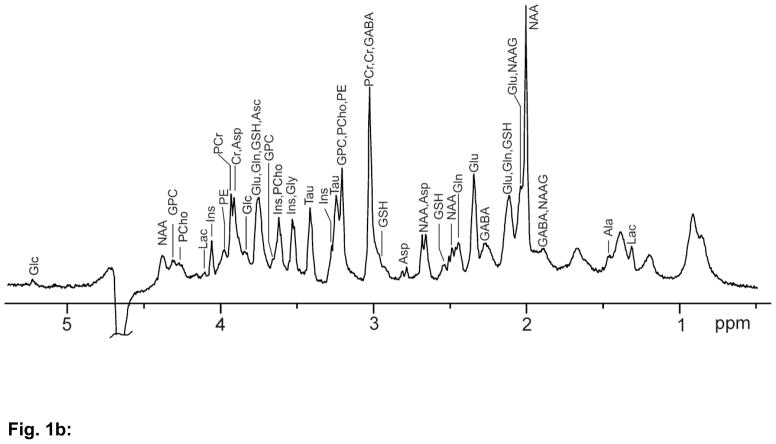
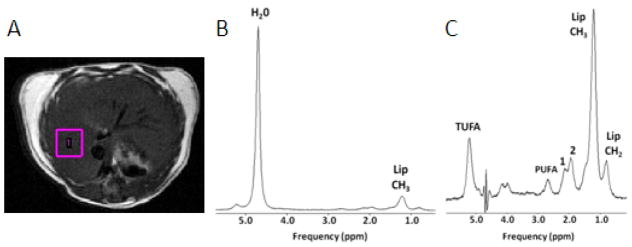
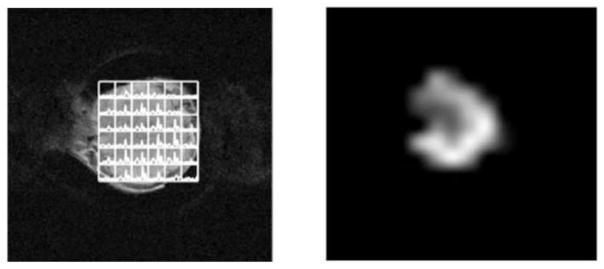
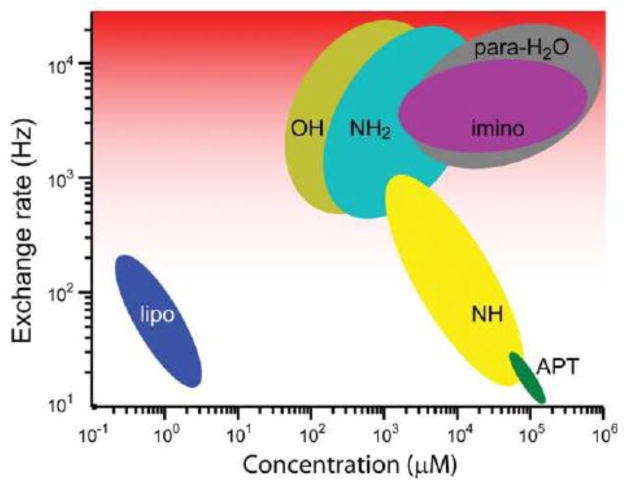
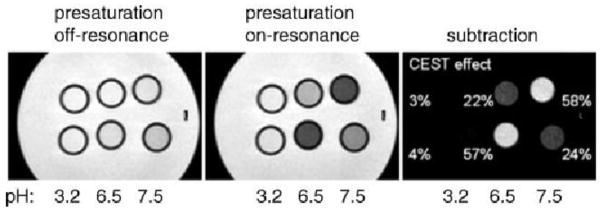
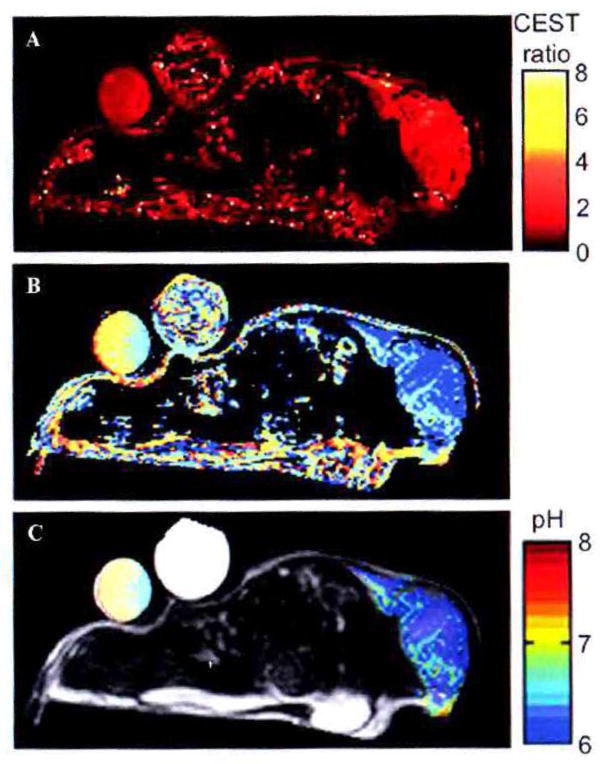
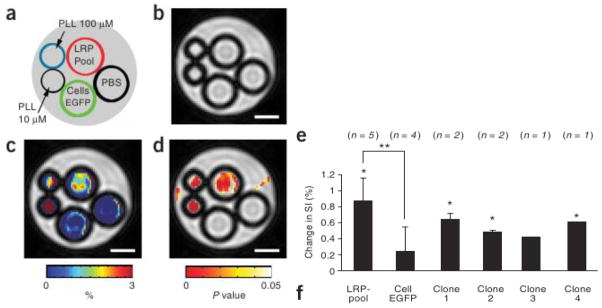
This review focuses on the applications of high magnetic field magnetic resonance imaging (MRI) and spectroscopy (MRS) to cancer studies in small animals. High-field MRI can provide information about tumor physiology, the microenvironment, metabolism, vascularity and cellularity. Such studies are invaluable for understanding tumor growth and proliferation, response to treatment and drug development. The MR techniques reviewed here include (1)H, (31)P, chemical exchange saturation transfer imaging and hyperpolarized (13)C MRS as well as diffusion-weighted, blood oxygen level dependent contrast imaging and dynamic contrast-enhanced MRI. These methods have been proven effective in animal studies and are highly relevant to human clinical studies.


Figures

Fig. 1
Fig. 1
Fig. 1a: 1H MR spectrum from a mouse brain obtained on a 7.0 Tesla scanner using a PRESS spectroscopic imaging pulse sequence with TR = 2500 ms, TE = 12 ms, nominal voxel size = 4.8 μL, VAPOR water suppression and outer volume suppression. ALA, alanine; Cho, choline; Cr, creatine; GABA, γ– aminobutyric acid; Gln, glutamine; Ino, myo-inositol; Lac, lactate; MM, macromolecules; NAA, N-acetyl aspartate; NAAG, N-aceylaspartyl glutamate; PCr, phosphocreatine; Tau, taurine. Figure modified with permission from Simoes et al. Neuromethods (2012). Fig. 1b: High-resolution in vivo rat brain spectrum obtained on a 14.1 T MR spectrometer. Approximately 20 metabolites were detected using an ultrashort echo time (2.8 ms) and TR = 4 s. Voxel size was 3 × 4 × 4 mm3 and 480 data frames were averaged. Figure generously supplied by V. Mlynarik, Ecole Polytechnique Fédérale de Lausanne, Lausanne, Switzerland.
Fig. 1
Fig. 1
Fig. 1a: 1H MR spectrum from a mouse brain obtained on a 7.0 Tesla scanner using a PRESS spectroscopic imaging pulse sequence with TR = 2500 ms, TE = 12 ms, nominal voxel size = 4.8 μL, VAPOR water suppression and outer volume suppression. ALA, alanine; Cho, choline; Cr, creatine; GABA, γ– aminobutyric acid; Gln, glutamine; Ino, myo-inositol; Lac, lactate; MM, macromolecules; NAA, N-acetyl aspartate; NAAG, N-aceylaspartyl glutamate; PCr, phosphocreatine; Tau, taurine. Figure modified with permission from Simoes et al. Neuromethods (2012). Fig. 1b: High-resolution in vivo rat brain spectrum obtained on a 14.1 T MR spectrometer. Approximately 20 metabolites were detected using an ultrashort echo time (2.8 ms) and TR = 4 s. Voxel size was 3 × 4 × 4 mm3 and 480 data frames were averaged. Figure generously supplied by V. Mlynarik, Ecole Polytechnique Fédérale de Lausanne, Lausanne, Switzerland.
Fig. 2
Fig. 2
Proton spectrum from a mouse with fatty liver. A) liver tissue volume, B) 1H spectrum from indicated tissue volume showing water and lipid CH3 peaks, C) vertically zoomed spectrum showing multiple lipid peaks. Data were obtained on a 7.0 Tesla Bruker scanner using PRESS with TE/TR = 13.4 ms/5000 ms, respiratory triggering, spectral width/points = 4000 Hz/2048 pts, 64 acquisitions, and voxel size = 4.67 × 2.9 × 3 = 40.6 mm3. TUFA, total unsaturated fatty acids; PUFA, polyunsaturated fatty acids; LIP, lipid; 1 hydrogen at α-methylene to carboxyl at 2.22 ppm (COO-CH2-CH2), 2 Allylic hydrogen (–CH2–CH=CH–) at 2.02 ppm.
Fig. 3
Fig. 3
Example of a metabolite map generated from proton CSI data in a tumor xenograft. Left, proton CSI spectral grid overlaid on corresponding T1-weighted image of a prostate cancer xenograft in the mouse. CSI images were acquired with FOV 32 × 32 mm2, 16 × 16 phase encoding steps, slice thickness 4 mm, TR = 1s, TE = 75 ms, spectral width 2000 Hz, 8 data frames averaged. Right, corresponding tCho metabolite map generated by integration of the tCho peak area in each spectral voxel. Adapted from (Le et al., 2009).
Fig. 4
Fig. 4
A schematic of the dynamic nuclear polarization process. At normal thermal equilibrium there is almost an equal distribution of nuclear spins in the low and high energy spin states in the presence of an external B0 field, with a correspondingly miniscule net spin polarization. At the low temperature of 4 K, doped free electron spins achieve a near complete polarization. By irradiating at the frequency of the electron resonance frequency, one pumps the nuclear spin distribution to a hyperpolarized state, a few percent to close to 100% polarization, through spin polarization transfer from the pre-polarized electron spin reservoir
Fig. 5
Fig. 5
Representative in vivo 1H-decoupled 31P MR spectra of an MCa tumor implanted on the foot pad of a CH3/He mouse (A) fed a normal choline-containing diet and (B) a phosphonium choline (ChoP)-supplemented diet (phosphonium region of the spectrum at ~ 28 ppm – 22 ppm not shown here). Using the phosphonium analog of choline, the metabolism of phospholipid precursors could be followed in vivo through the detection of the phosphonium analogs of these phospholipid precursors (e.g. PC). Signal assignments are as follows: PE, phosphoethanolamine; PC, phosphocholine; PChoP, phosphoryl moiety of the phosphonium analog of PC; Pi, inorganic phosphate; GPE, glycerophosphoethanolamine; GPC, glycerophosphocholine; PCr, phosphocreatine; α-/β-NDP, α-/β-nucleoside diphosphate; α-/β-/γ-NTP, α-/β-/γ-nucleoside triphosphate; NAD(H), overlapping signals of nicotinamide adenine dinucleotide (NAD+, NADH) and Nicotinamide adenine dinucleotide phosphate (NADP+, NADPH); DPDE, diphosphodiesters. Adapted with permission from (Street et al., 1997).
Fig. 6
Fig. 6
Effect of combination chemotherapy on tumor metabolism. Representative in vivo 31P MR spectra (no 1H decoupling) of human diffuse large B-cell lymphoma xenografts in SCID mice (A) before and (B) after three cycles of combination chemotherapy with cyclophosphamide, hydroxy doxorubicin, Oncovin, prednisone, and bryostatin 1 (CHOPB). The treatment of tumors with CHOPB reduced significantly tumoral PME/β-NTP ratio when compared to untreated tumors. Signal assignments as in Fig. 5. Adapted with permission from (Huang et al., 2007).
Fig. 7
Fig. 7
pH measurement by 31P MRS – (A) In vivo 31P MR spectrum (no 1H decoupling) of a tumor xenograft in a SCID mouse. Signal assignments: 3-APP, exogenous pH marker 3-aminopropylphosphonate; Pi, inorganic phosphate (other signals assigned as in Fig. 3). (B) Distributions of tumoral pH (pHPi, mainly intracellular) and extracellular tumoral pH (pH3APP) in a tumor xenograft, obtained by conversion of 31P chemical shifts of inorganic phosphate and 3-APP, respectively and plotted as corrected signal intensity versus pH. The pH distributions (obtained after intensity corrections) are the result of the tumoral pH heterogeneity, as well as signal broadening due for one to T2 relaxation and, in case of 3-APP, also due to its multiplet structure from 1H coupling. Adapted with permission from (Raghunand, 2006).
Fig. 8
Fig. 8
Log-plot of concentrations that yield a 5% CEST effect for different chemical moieties. The plots for proton and molecular exchange agents are dependent on molecular size. The compartmental exchange curve is a function of particle radius, affecting both exchange rate and number of protons. Reproduced with permission from Van Zijl and Yadav,(van Zijl and Yadav, 2011)
Fig. 9
Fig. 9
The effect of pH on detectability of the CEST effect on two Yb(III)- DOTAM complexes. Reproduced with permission from (Pikkemaat et al., 2007).
Fig. 10
Fig. 10
Detection of Yb based PARACEST agent with a wider pH range. Figure 9B is the initial pH map and figure 9C is the pH map with statistically significant amide and amine CEST effects. Reproduced with permission (Liu et al., 2012)
Fig. 11
Fig. 11
CEST imaging poly-L-lysine, LRP phantoms and control cell extracts. Fig 11a shows phantom layout, Fig 11b displays the reference image at Dw = −3.76 ppm, Fig 11c is the difference image for Dw = ±3.76 ppm, and Fig 11d is a t-test map comparing Dw = ±3.76 ppm. (e) Signal intensity difference for different samples, including four LRP clones.
Fig. 12
Fig. 12
In vivo CEST imaging on a rat brain with the LRP expressing tumor cells and control tumor cells, transfected with an empty vector, implanted in opposite spheres of a mouse brain. The expression of LRP in the tumor is detected specifically with CEST imaging. Reproduced with permission (Terreno et al., 2008)
Fig. 13
Fig. 13
TOFTS-MODEL. Schematic of the Tofts-Kety model. Tissue (dashed box) consists of two compartments, plasma compartment with fractional volume vp, and extracellular extravascular compartment with fractional volume ve. The contrast is delivered with the arterial input function (AIF) at the concentration CA(t). The contrast first enters the plasma compartment and leaks into the EES at the rate determined by Ktrans and back at the rate of kep.
Fig. 14
Fig. 14
Population average vascular input functions (VIF) measured in mice using LMW contrast agent Gd-DTPA (a) and MMW contrast agent P846 (b) and an example of two individual VIFs (red and blue curves) versus population average VIF (black curve) measured with Gd-DTPA (c). Adapted with permission from (Loveless et al., 2012).
Fig. 15
Fig. 15
Maps of Ktrans, ve, histological section and a 3-color image of a subcutaneous V-27 melanoma xenograft grown in nu/nu mice. The 3-color map indicates voxels with unphysiological parameter values (ve<0.05 and ve>0.35, red), low Ktrans (Ktrans<0.05 min−1, green) and remaining voxels (blue). Adapted with permission from (Egeland et al., 2012).
Fig. 16
Fig. 16
Normalized changes of ADC measured in HT29 colorectal xenografts in BALB/c nu/nu mice after 4 days (A) and 11 days (B) of treatment versus tumor doubling growth delay after chemotherapy alone (Cap – capecitabine, Oxa – oxaliplatin) or chemotherapy combined with irradiation (IR, 2 Gy for 5 days, 5 days/week for 2 weeks starting on day 2). Adapted with permission from (Seierstad et al., 2007).

Similar articles

Cited by

References

    1. Aboagye EO, Bhujwalla ZM. Malignant transformation alters membrane choline phospholipid metabolism of human mammary epithelial cells. Cancer Res. 1999;59:80–4. - PubMed
    1. Ackerman JJ, Grove TH, Wong GG, Gadian DG, Radda GK. Mapping of metabolites in whole animals by 31P NMR using surface coils. Nature. 1980;283:167–70. - PubMed
    1. Ackerstaff E, Pflug BR, Nelson JB, Bhujwalla ZM. Detection of increased choline compounds with proton nuclear magnetic resonance spectroscopy subsequent to malignant transformation of human prostatic epithelial cells. Cancer Res. 2001;61:3599–603. - PubMed
    1. Agris PF, Campbell ID. Proton nuclear magnetic resonance of intact Friend leukemia cells: phosphorylcholine increase during differentiation. Science. 1982;216:1325–7. - PubMed
    1. Aime S, Delli Castelli D, Terreno E. Highly sensitive MRI chemical exchange saturation transfer agents using liposomes. Angewandte Chemie. 2005;44:5513–5. - PubMed

Publication types