Comparative Study
. 2014 Feb 21;289(8):5061-73.
doi: 10.1074/jbc.M113.508507. Epub 2013 Dec 27.

Rod visual pigment optimizes active state to achieve efficient G protein activation as compared with cone visual pigments

Affiliations
Comparative Study

Rod visual pigment optimizes active state to achieve efficient G protein activation as compared with cone visual pigments

Keiichi Kojima et al. J Biol Chem. .

Abstract

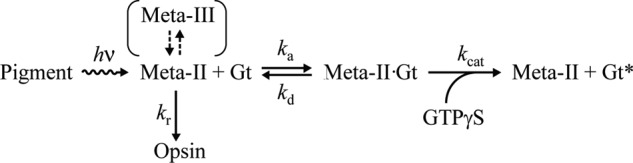
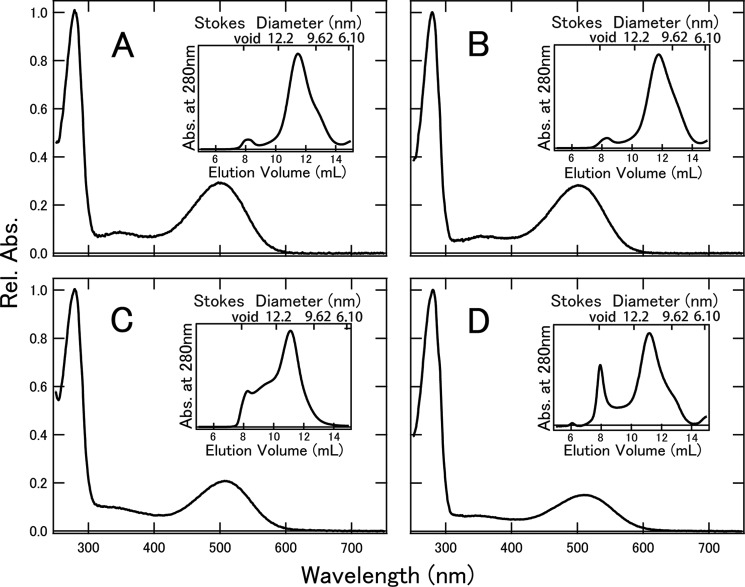
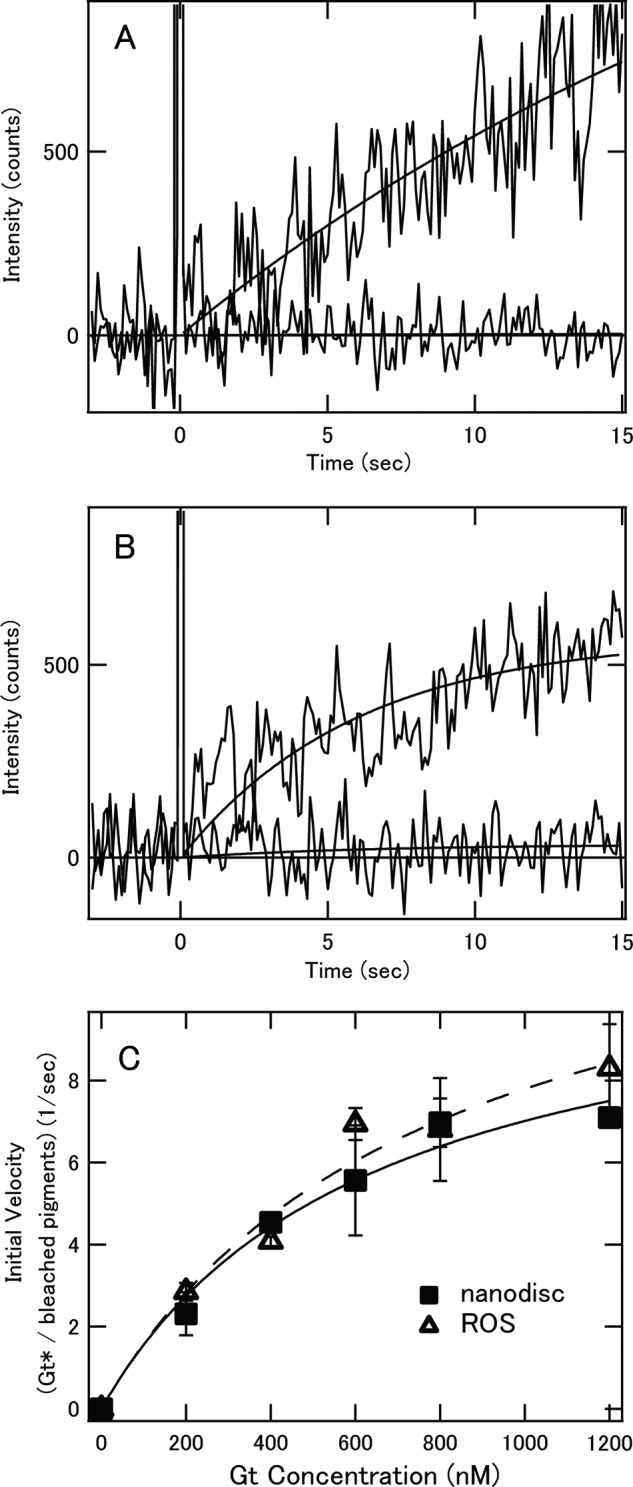
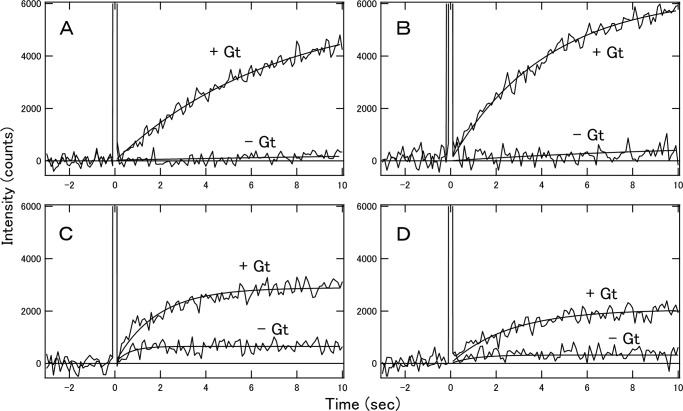
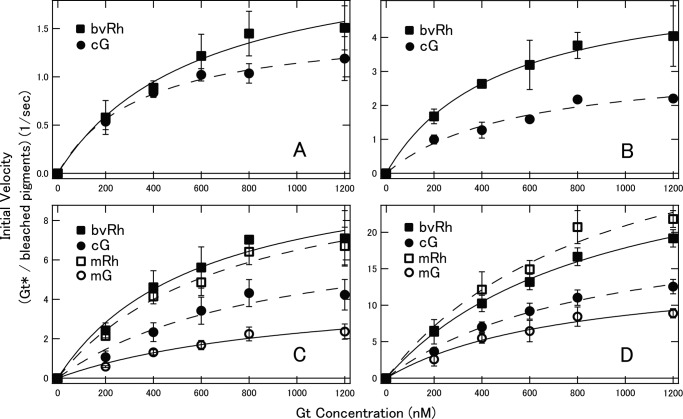
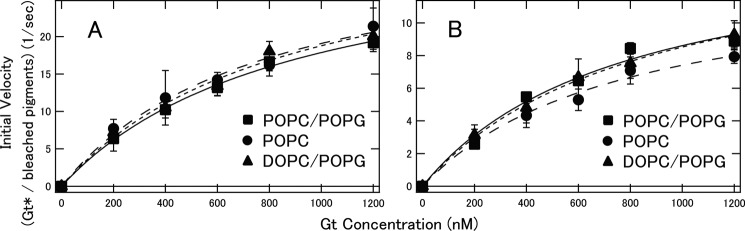
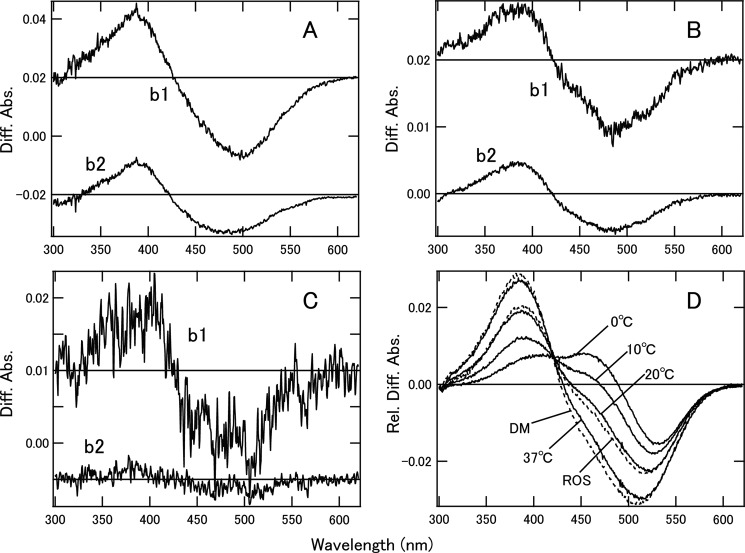
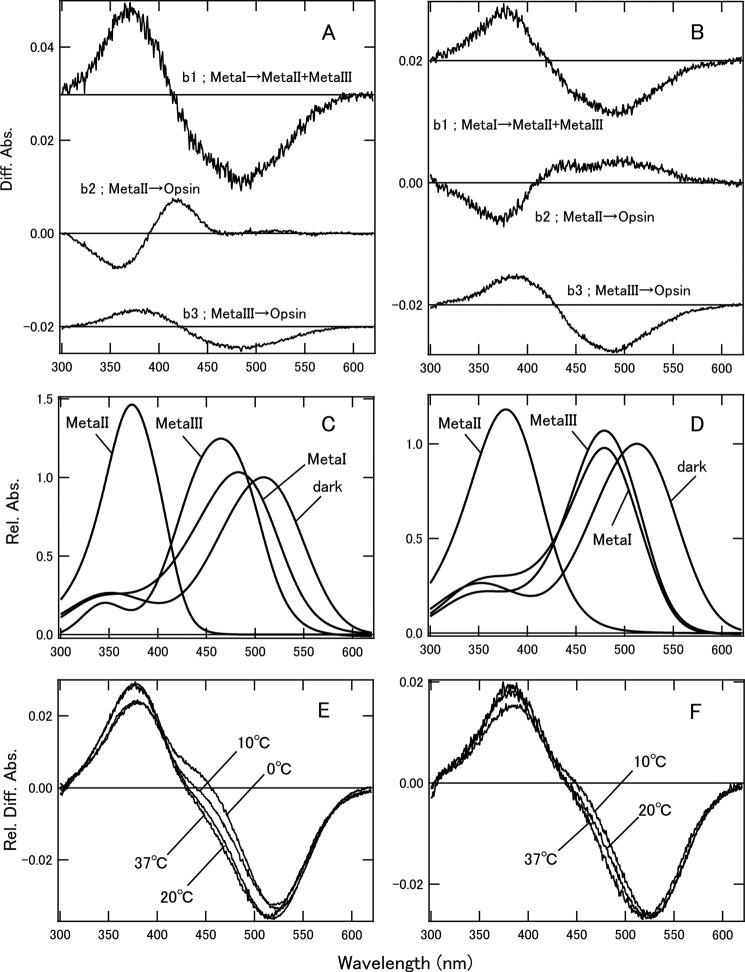
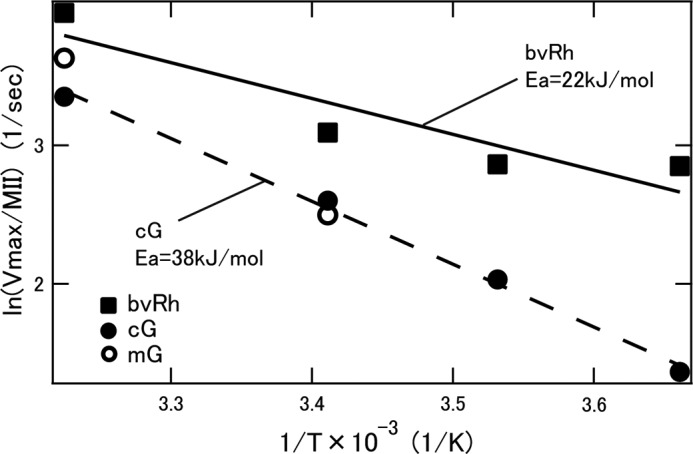
Most vertebrate retinas contain two types of photoreceptor cells, rods and cones, which show different photoresponses to mediate scotopic and photopic vision, respectively. These cells contain different types of visual pigments, rhodopsin and cone visual pigments, respectively, but little is known about the molecular properties of cone visual pigments under physiological conditions, making it difficult to link the molecular properties of rhodopsin and cone visual pigments with the differences in photoresponse between rods and cones. Here we prepared bovine and mouse rhodopsin (bvRh and mRh) and chicken and mouse green-sensitive cone visual pigments (cG and mG) embedded in nanodiscs and applied time-resolved fluorescence spectroscopy to compare their Gt activation efficiencies. Rhodopsin exhibited greater Gt activation efficiencies than cone visual pigments. Especially, the Gt activation efficiency of mRh was about 2.5-fold greater than that of mG at 37 °C, which is consistent with our previous electrophysiological data of knock-in mice. Although the active state (Meta-II) was in equilibrium with inactive states (Meta-I and Meta-III), quantitative determination of Meta-II in the equilibrium showed that the Gt activation efficiency per Meta-II of bvRh was also greater than those of cG and mG. These results indicated that efficient Gt activation by rhodopsin, resulting from an optimized active state of rhodopsin, is one of the causes of the high amplification efficiency of rods.

Keywords: Fluorescence Spectroscopy; G Protein Activation Efficiency; G Protein-coupled Receptors (GPCR); Membrane Bilayer; Membrane Proteins; Rhodopsin; UV Spectroscopy.


Figures

SCHEME 1.
SCHEME 1.
Michaelis-Menten model for Gt activation by photoactivated pigments.
FIGURE 1.
FIGURE 1.
Absorption spectra of bvRh (A), mRh (B), cG (C), and mG (D) in POPC/POPG nanodiscs. The spectra were measured at 0 °C. The insets show chromatograms of nanodisc size exclusion. We collected the peak fraction at 10.5–12.5 ml corresponding to the Stokes diameters of nanodiscs containing pigments. Rel. Abs., relative absorbance.
FIGURE 2.
FIGURE 2.
Comparison of Gt activation efficiencies of bvRh in ROSs and nanodiscs. A, Gt activation by photoactivated bvRh in POPC/POPG nanodiscs. 2 nm pigment was mixed with 400 nm Gt and 100 μm GTPγS at 20 °C. The mixture was irradiated with a yellow flash at time 0, and the fluorescence intensity was monitored (upper traces). The fluorescence increase that originated from opsin formation was monitored in the absence of Gt at 20 °C (lower traces). B, Gt activation by photoactivated bvRh in ROSs. 2 nm pigment was mixed with 400 nm Gt and 100 μm GTPγS at 20 °C. The mixture was irradiated with a yellow flash at time 0, and the fluorescence intensity was monitored (upper traces). The fluorescence increase that resulted from opsin formation was monitored in the absence of Gt at 20 °C (lower traces). C, initial velocities of Gt activation by photoactivated bvRh in ROSs and POPC/POPG nanodiscs at 20 °C (open triangles and filled squares, respectively). Plots of initial velocities were fitted by the Michaelis-Menten equation (solid line for ROSs and dashed line for nanodiscs). Error bars represent S.D. estimated from three independent measurements.
FIGURE 3.
FIGURE 3.
Gt activation by photoactivated bvRh (A), mRh (B), cG (C), and mG (D) in POPC/POPG nanodiscs. 20 nm pigment was mixed with 400 nm Gt and 100 μm GTPγS at 37 °C. The mixture was irradiated with a yellow flash at time 0, and the fluorescence intensity was monitored (upper traces). The fluorescence increase that originated from opsin formation was monitored in the absence of Gt at 37 °C (lower traces).
FIGURE 4.
FIGURE 4.
Initial velocities of Gt activation by photoactivated pigments in POPG/POPG nanodiscs. Initial velocities of bvRh, cG, mRh, and mG (closed squares, closed circles, open squares, and open circles, respectively) at 0 (A), 10 (B), 20 (C), and 37 °C (D) were plotted against Gt concentration and fitted by the Michaelis-Menten equation or Equation 29 (solid lines for bvRh and mG and dashed lines for mRh and cG) to estimate Vmax/R*. Error bars represent S.D. estimated from three independent measurements.
FIGURE 5.
FIGURE 5.
Initial velocities of Gt activation by photoactivated bvRh (A) and mG (B) in POPC/POPG, POPC, and DOPC/POPG nanodiscs. Initial velocities of bvRh and mG in POPC/POPG, POPC, and DOPC/POPG nanodiscs (closed squares, closed circles, and closed triangles, respectively) at 37 °C were plotted against Gt concentration and fitted by the Michaelis-Menten equation or Equation 29 (solid lines for POPC/POPG nanodiscs, dashed lines for POPC nanodiscs, and dotted lines for DOPC/POPG nanodiscs) to estimate Vmax/R*. Error bars represent S.D. estimated from three independent measurements.
FIGURE 6.
FIGURE 6.
Photobleaching processes and estimation of Meta-II ratios of bvRh. The b-spectra of bvRh in POPC/POPG nanodiscs at 20 °C (A), in ROSs at 20 °C (B), and in DM suspension at 20 °C (C) calculated by SVD analysis are presented. The b-spectra of bvRh in nanodiscs at 0 and 10 °C were consistent with those at 20 °C. The b1 spectrum of bvRh in nanodiscs at 37 °C was consistent with that at 20 °C. Two-step formation of Meta-II (b1 and b2) is consistent with previous reports that suggested the presence of two forms of Meta-I (Meta-Ia and Meta-Ib) (32, 45). b0 spectra, which were difference spectra in the equilibrium state, of bvRh in nanodiscs and ROSs and DM suspension are shown in D (solid lines for bvRh in nanodiscs at 0–37 °C and dashed lines for bvRh in ROSs or DM suspension at 20 °C). These spectra were fitted by Meta-I and Meta-II model spectra as described previously (36, 37) to estimate FMeta-II (Table 3). Diff. Abs., difference absorbance; Rel. Diff. Abs., relative difference absorbance.
FIGURE 7.
FIGURE 7.
Photobleaching processes and estimation of Meta-II ratios of cG and mG in POPC/POPG nanodiscs. A, b-spectra calculated by SVD analysis of cG in nanodiscs at 20 °C. At 0 and 10 °C, b1 and b2 spectra were consistent with b1 at 20 °C, and b3 and b4 were consistent with b2 and b3, respectively, at 20 °C. At 37 °C, b-spectra were consistent with those at 20 °C. B, b-spectra calculated by SVD analysis of mG in nanodiscs at 20 °C. At 10 and 37 °C, the b-spectra were consistent with those at 20 °C. The time constants of b1, b2, and b3 were 4.9 ms, 79 ms, and 4.6 s, respectively, at 20 °C. C, model absorption spectra of dark state and photobleaching intermediates of cG. Absorption maxima of cG were 508 nm for dark state, 483 nm for Meta-I, 374 nm for Meta-II, and 465 nm for Meta-III. D, model absorption spectra of dark state and photobleaching intermediates of mG. Absorption maxima of mG were 513 nm for dark state, 479 nm for Meta-I, 378 nm for Meta-II, and 479 nm for Meta-III. For details, see the text. E, calculated difference spectra (Beq) of equilibrium states of cG at 0–37 °C. These spectra were fitted by model dark state, Meta-I, Meta-II, and Meta-III spectra to estimate FMeta-II (Table 4). F, calculated difference spectra (Beq) in equilibrium states of mG at 10–37 °C. These spectra were also fitted by the model spectra to estimate FMeta-II (Table 4). Diff. Abs., difference absorbance; Rel. Diff. Abs., relative difference absorbance.
FIGURE 8.
FIGURE 8.
Arrhenius plots of turnover rates (Vmax/MII) of Gt activation by bvRh, cG, and mG (closed squares, closed circles, and open circles, respectively) in POPC/POPG nanodiscs. Plots of bvRh and cG were fitted by straight lines (solid and dashed lines, respectively) to calculate apparent activation energy (Ea).

Similar articles

Cited by

References

    1. Fu Y., Yau K. W. (2007) Phototransduction in mouse rods and cones. Pflugers Arch. 454, 805–819 - PMC - PubMed
    1. Kawamura S., Tachibanaki S. (2008) Rod and cone photoreceptors: molecular basis of the difference in their physiology. Comp. Biochem. Physiol. A Mol. Integr. Physiol. 150, 369–377 - PubMed
    1. Yau K. W. (1994) Phototransduction mechanism in retinal rods and cones. The Friedenwald Lecture. Invest. Ophthalmol. Vis. Sci. 35, 9–32 - PubMed
    1. Ebrey T., Koutalos Y. (2001) Vertebrate photoreceptors. Prog. Retin. Eye Res. 20, 49–94 - PubMed
    1. Arshavsky V. Y., Lamb T. D., Pugh E. N., Jr. (2002) G proteins and phototransduction. Annu. Rev. Physiol. 64, 153–187 - PubMed

Publication types